
Neonatal/Infant Resuscitation 4
Session: Neonatal/Infant Resuscitation 4
.jpg "Evan M. Giusto, MSN (he/him/his) photo")
Evan M. Giusto, MSN (he/him/his)
Neonatal Nurse Practitioner
UC Davis Health
Sacramento, California, United States
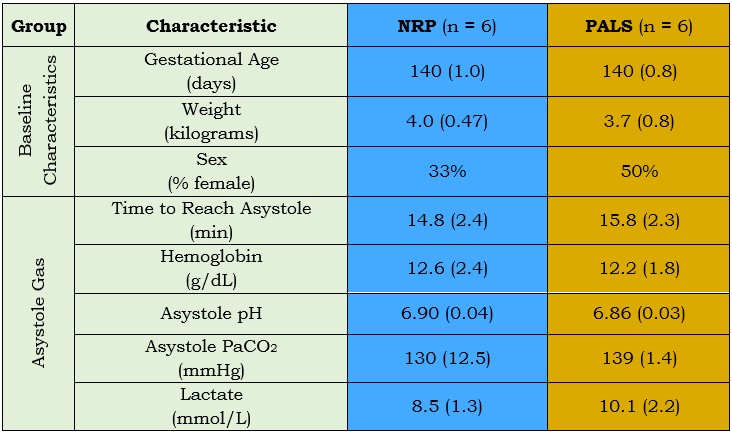 Values are mean (standard deviation)
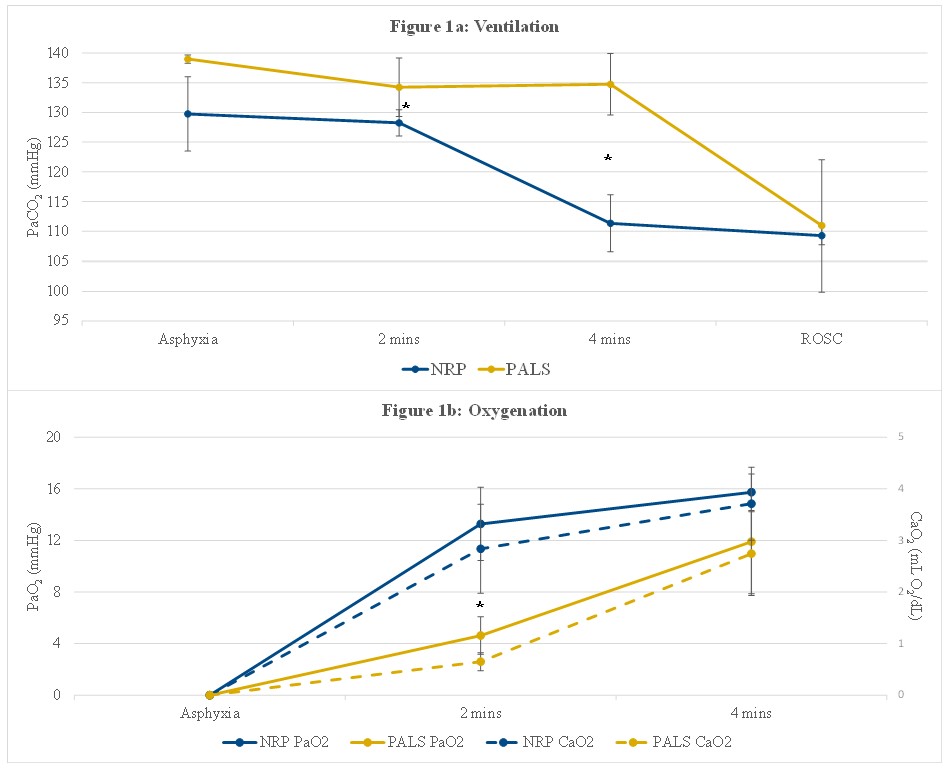 *p-value < 0.05 via unpaired t-test
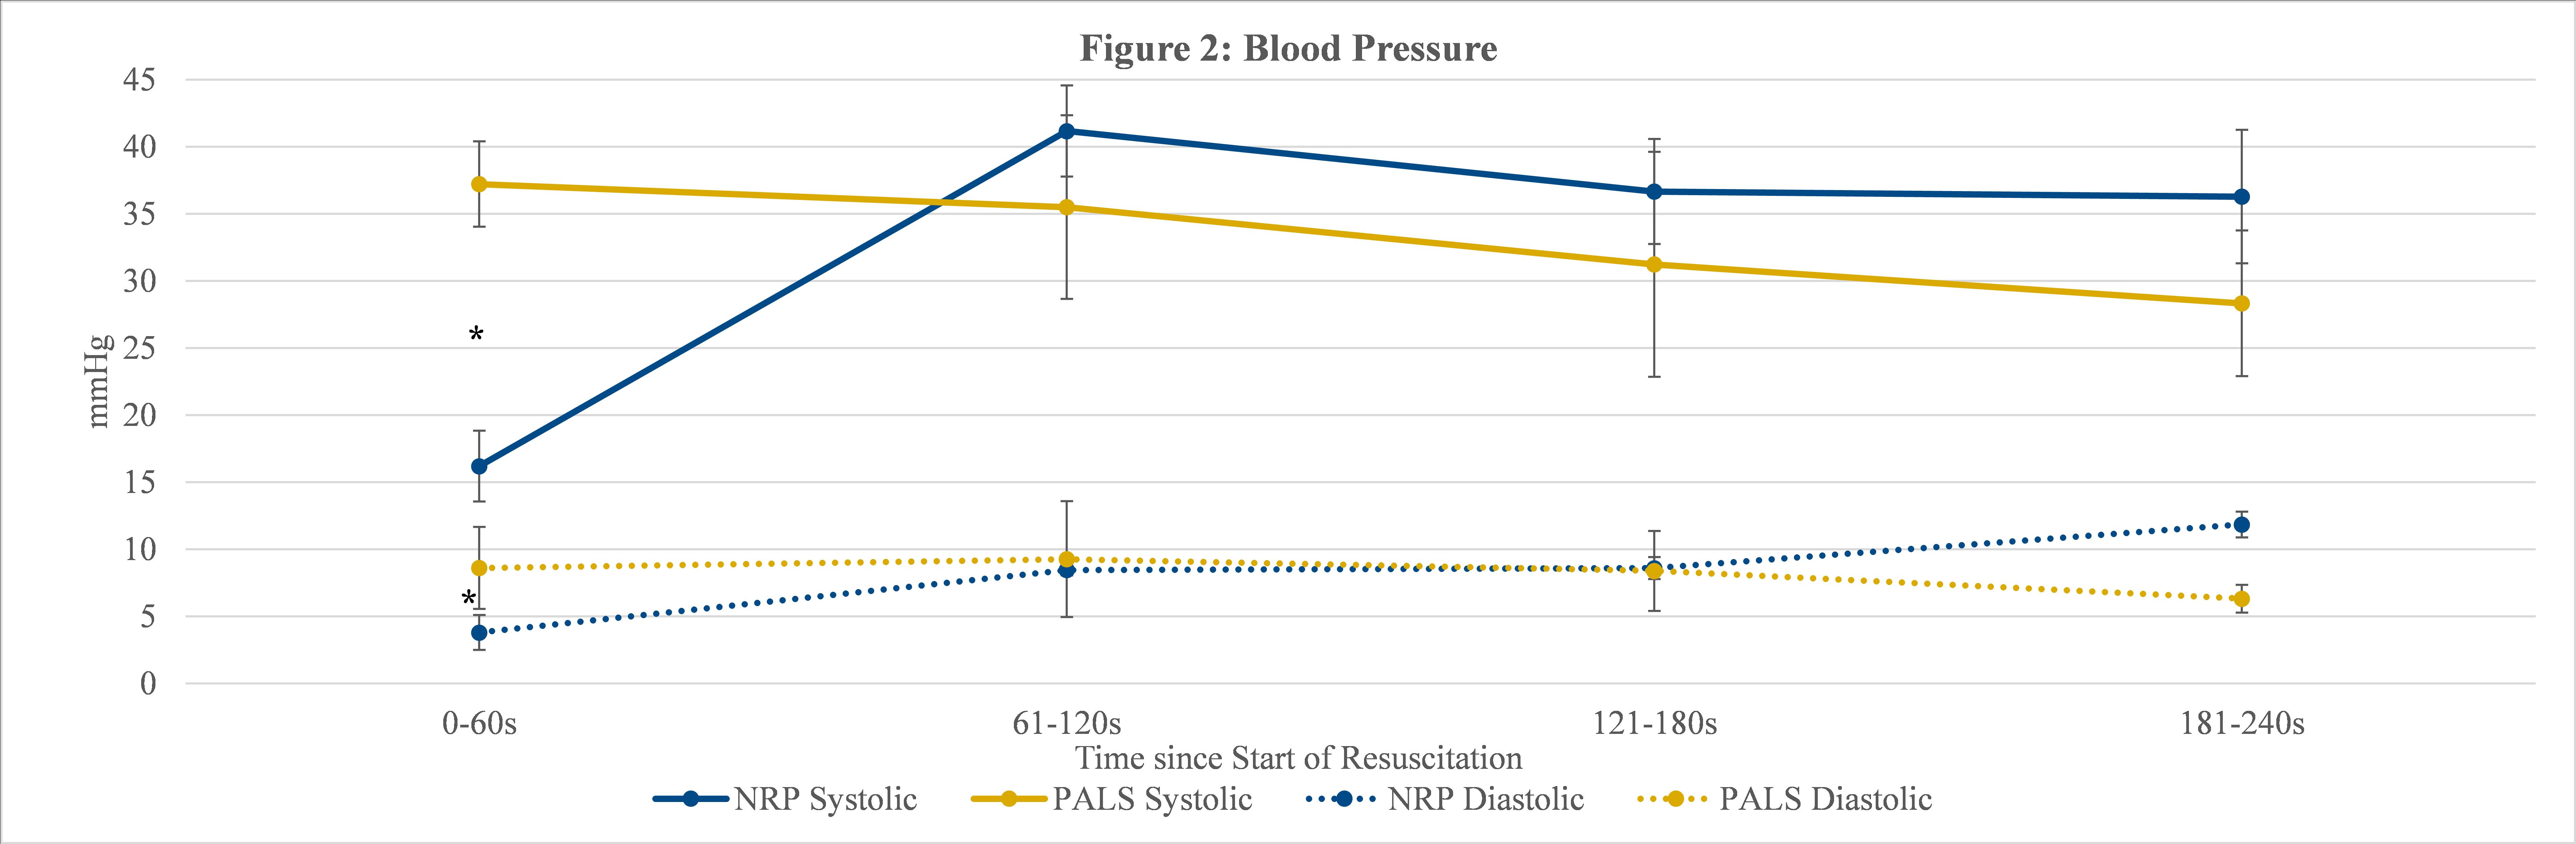 *p-value < 0.05 via unpaired t-testValues are mean (standard deviation)*p-value < 0.05 via unpaired t-test*p-value < 0.05 via unpaired t-test