
Neonatal Hematology & Bilirubin Metabolism 2
Session: Neonatal Hematology & Bilirubin Metabolism 2
Vivian Chang, MD
Fellow
Stony Brook Children's Hospital
Selden, New York, United States
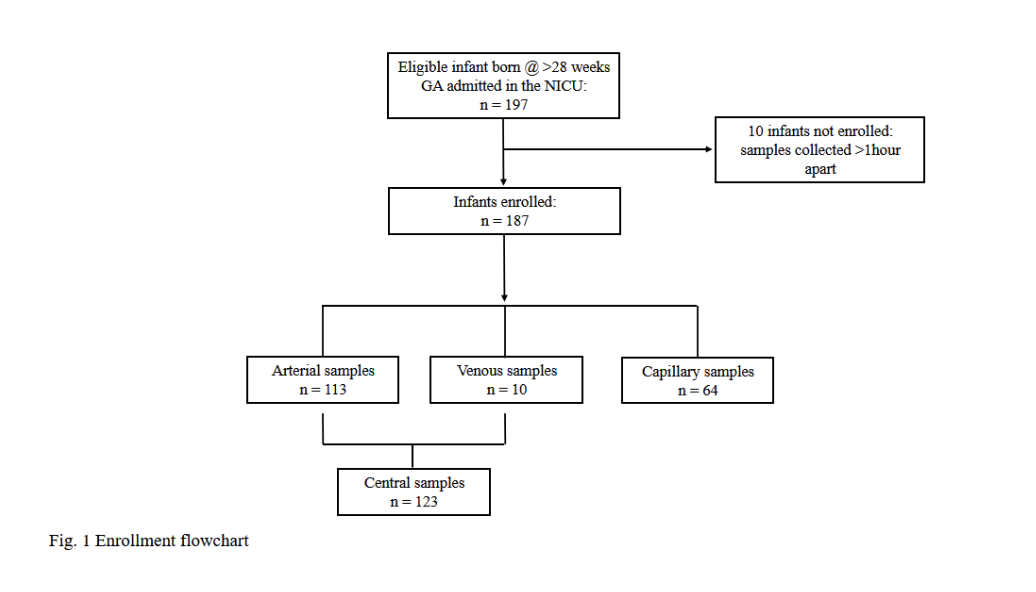 Enrollment Flow Chart
 .png) Subject Demographics
Subject Demographics.png) Bland-Altman plot shows agreement between all central lab (CL) and POC hemoglobin values using linear regression and a 95% confidence interval. The solid line represents a perfect agreement, while the dotted lines indicate the limits of agreement at ± 1.96 SD. UL, upper limit; LL, lower limit.
Bland-Altman plot shows agreement between all central lab (CL) and POC hemoglobin values using linear regression and a 95% confidence interval. The solid line represents a perfect agreement, while the dotted lines indicate the limits of agreement at ± 1.96 SD. UL, upper limit; LL, lower limit. 