
Neonatal General 11
Session: Neonatal General 11
.jpg "Leonora Blodgett (she/her/hers) photo")
Leonora Blodgett (she/her/hers)
PhD Student in Electrical and Computer Engineering
Northeastern University
Boston, Massachusetts, United States
.png) Figure 1: The change in movement activity before, during and after hypoxic episodes across 12 subjects for hypoxias lasting from 10-30s. The bold line represents the average across all subjects. Movement activity tends to decrease during and up to 30s after hypoxic events.
Figure 1: The change in movement activity before, during and after hypoxic episodes across 12 subjects for hypoxias lasting from 10-30s. The bold line represents the average across all subjects. Movement activity tends to decrease during and up to 30s after hypoxic events. 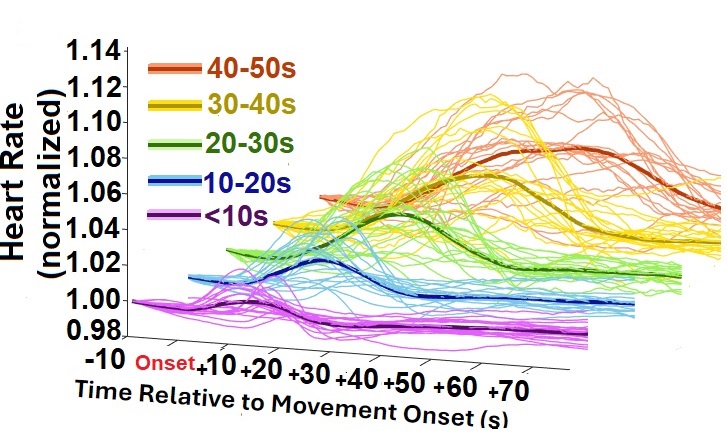 Figure 2: Heart rate response to movement of varying durations, collected 10s before, during, and several seconds after movement onset. Thin lines represent the average for each infant (50 total infants); thick lines represent the overall average. Heart rate was normalized based on each infant’s resting heart rate.
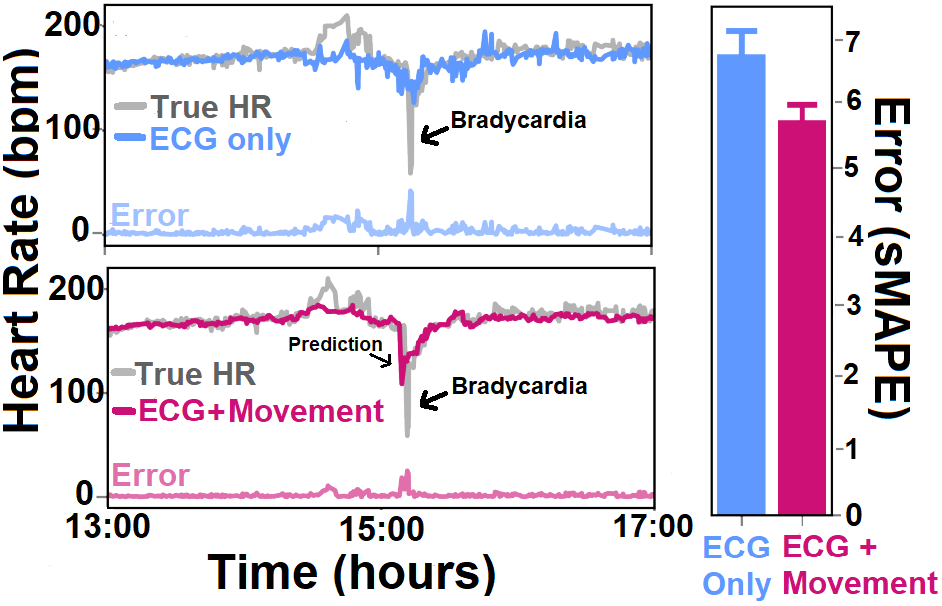 Figure 3: On left: Heart rate over a 4-hour period in which a subject experienced one bradycardia event. The blue forecast model is trained only on raw ECG data, while the red model includes movement features. On right: Error of 5 minute-ahead forecasts, averaged across a day.