
Neonatal General 10: Family Centered Care and Social Determinants of Health
Session: Neonatal General 10: Family Centered Care and Social Determinants of Health
Crystal Hsueh, Bachelor of Science (she/her/hers)
Student
University of California, Los Angeles
Los Angeles, California, United States
.jpg) (A) A diagram showing the inclusion and exclusion criteria for each aim, along with the number of infants before and after applying inverse propensity score weighting. Confounders balanced include maternal age, gestational age, sex, maternal obesity, hypertensive disorders of pregnancy, fetal growth restriction, maternal smoking during pregnancy, placental abruption, gestational diabetes, chorioamnionitis, and congenital anomalies. Propensity scores were derived using generalized boosted regression modeling to estimate the population average treatment effect. (B) Maternal and neonatal characteristics of the unweighted cohort. (C) Maternal and neonatal characteristics of the weighted population.
(A) A diagram showing the inclusion and exclusion criteria for each aim, along with the number of infants before and after applying inverse propensity score weighting. Confounders balanced include maternal age, gestational age, sex, maternal obesity, hypertensive disorders of pregnancy, fetal growth restriction, maternal smoking during pregnancy, placental abruption, gestational diabetes, chorioamnionitis, and congenital anomalies. Propensity scores were derived using generalized boosted regression modeling to estimate the population average treatment effect. (B) Maternal and neonatal characteristics of the unweighted cohort. (C) Maternal and neonatal characteristics of the weighted population.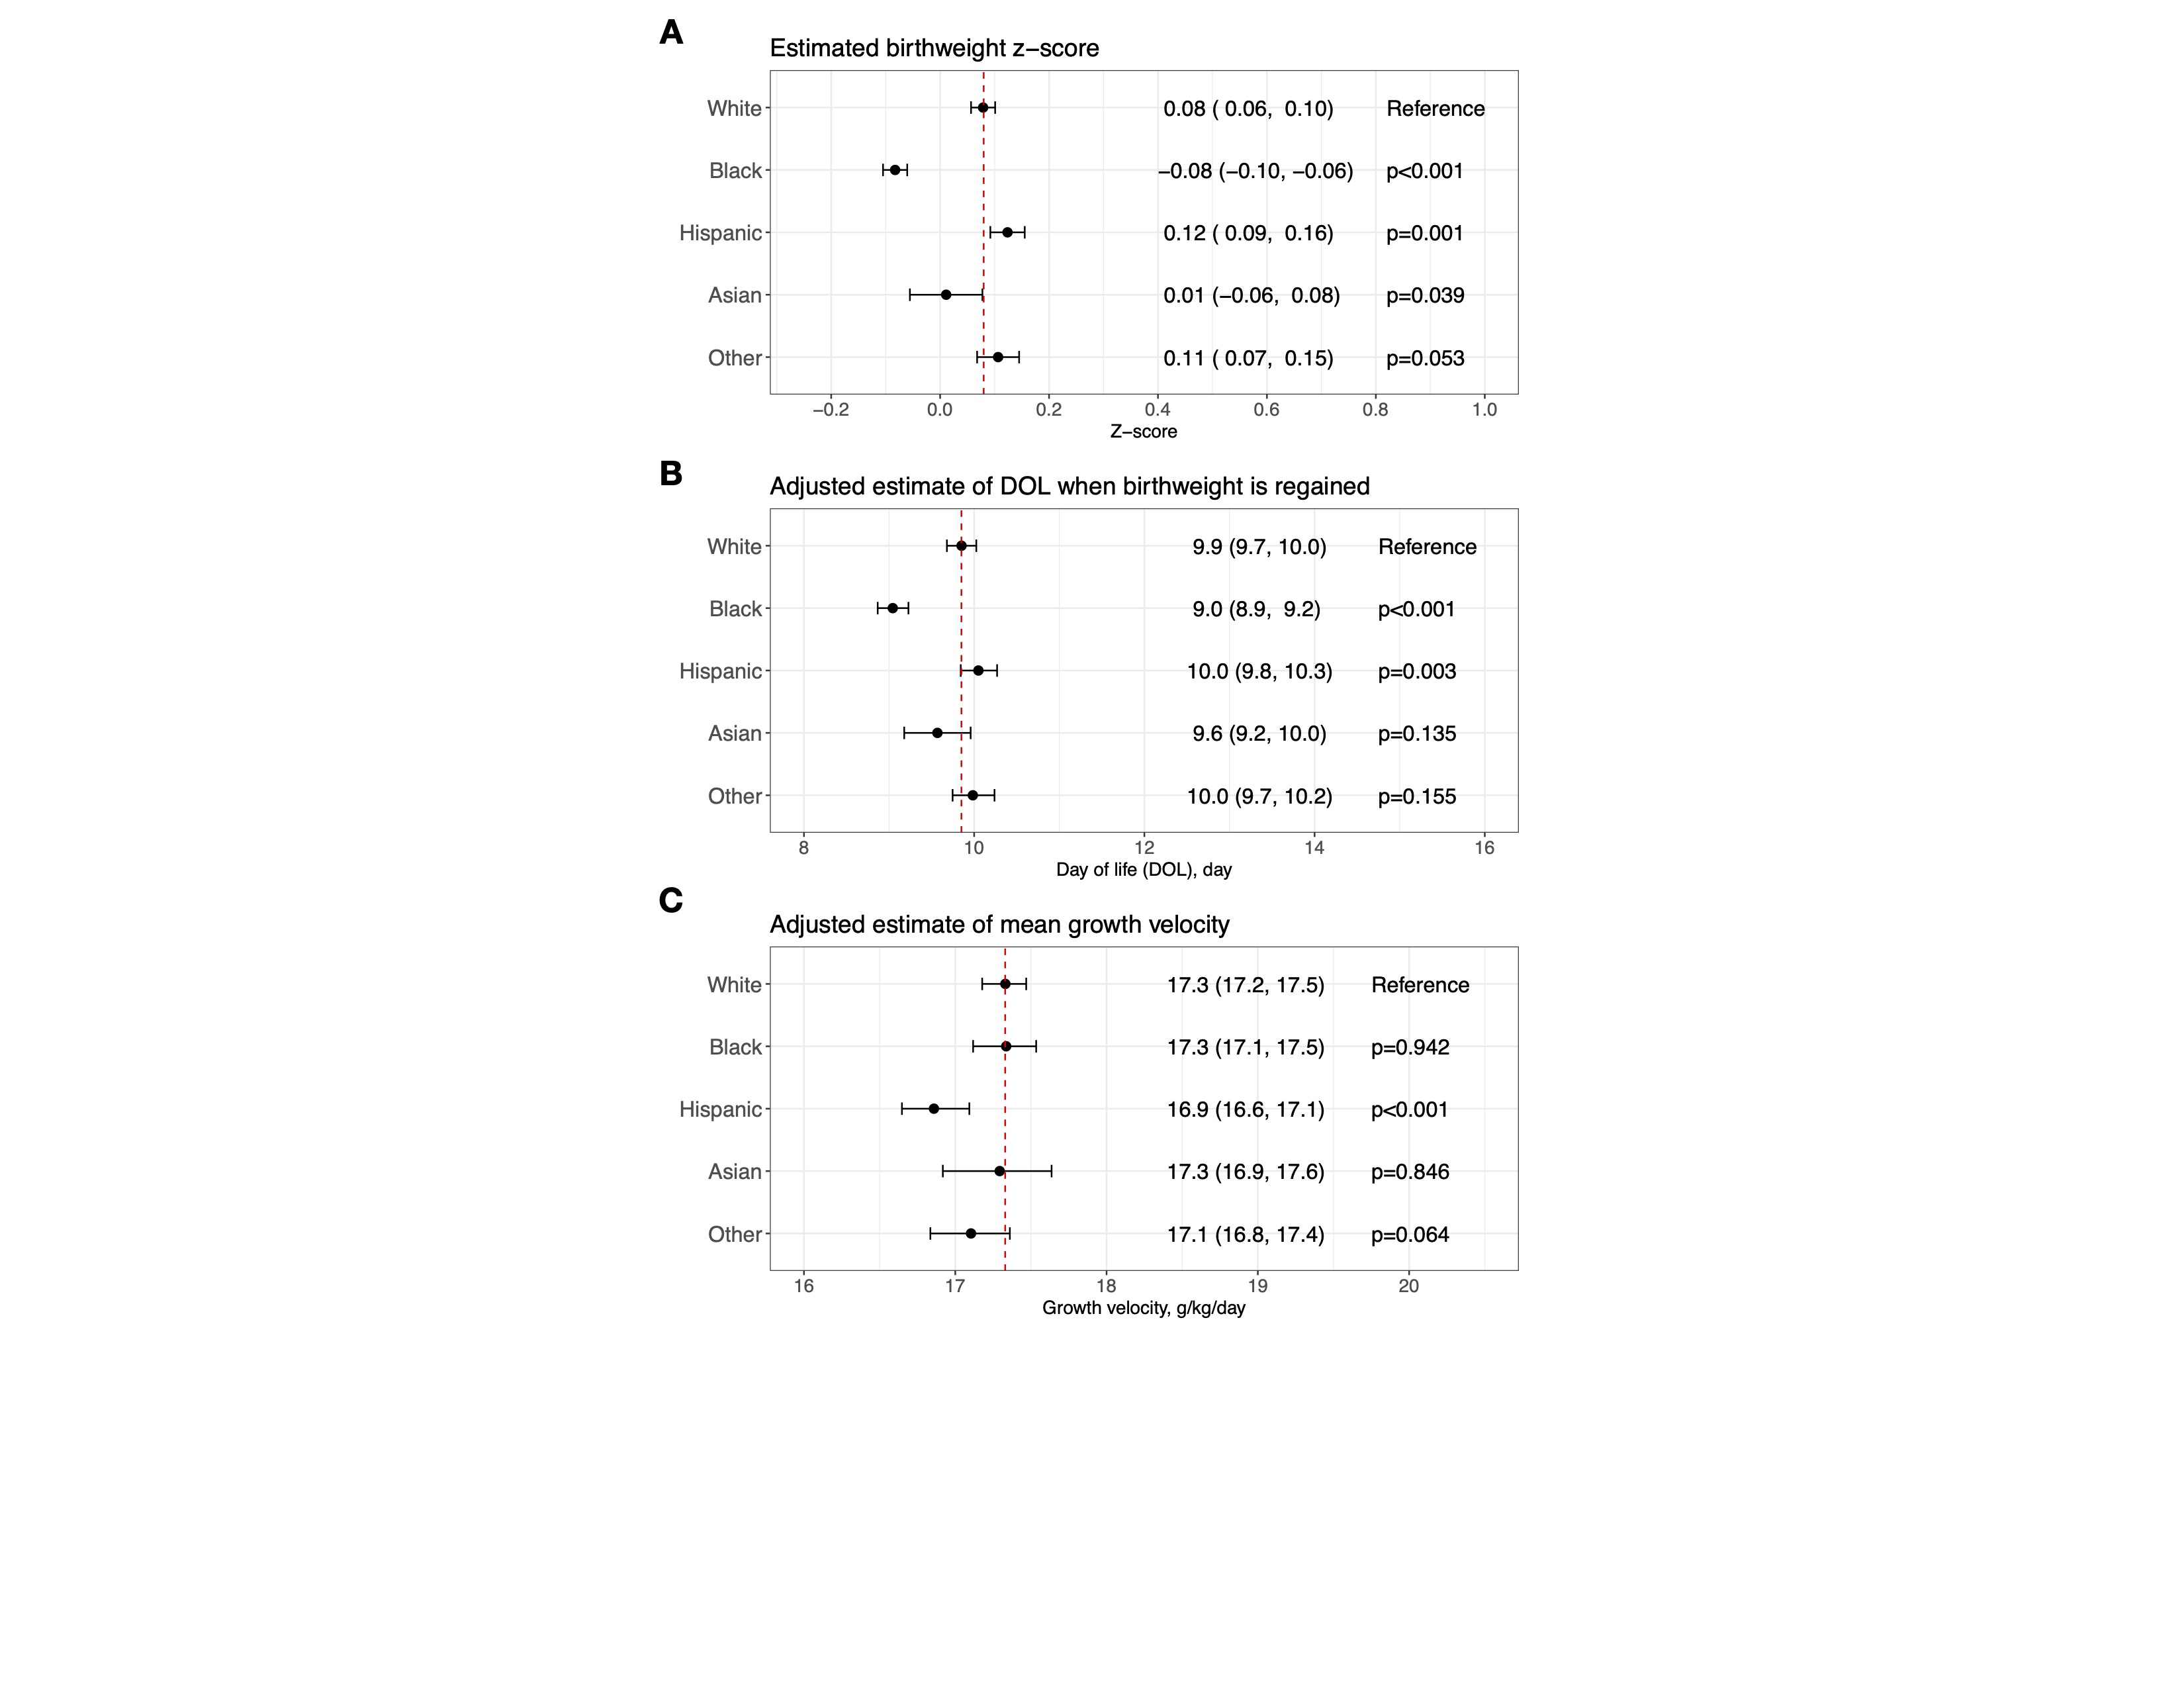 (A) A mixed-effects model was developed to assess racial and ethnic disparities in birth weight z-scores based on the entire weighted population shown in Figure 1C. The birth weight z-scores were calculated using intrauterine growth charts developed for White infants as part of this study. White was used as the reference. (B) A mixed-effects model was developed to assess racial and ethnic disparities in time-to-birth-weight-regain, based on a weighted subpopulation of infants who regained their birth weight by day of life (DOL) 27 (Figure 1A). The model was adjusted for APGAR scores at 1 and 5 minutes and birth weight z-scores, calculated using race/ethnicity-specific intrauterine growth charts developed for this study (for adjusting within each racial/ethnic group). Time-to-birth-weight-regain for White was used as the reference. (C) A mixed-effects model was developed to assess racial and ethnic disparities in mean growth velocity, using a weighted subpopulation of infants with a weight nadir by DOL10 and birth weight regained by DOL27 (Figure 1A). Mean growth velocity was calculated based on daily weight measurements from DOL10 to the last recorded weight between 33-34 weeks postmenstrual age. The model was adjusted for several covariates: APGAR scores at 1 and 5 minutes, birth weight z-scores (calculated using race/ethnicity-specific intrauterine growth charts developed for this study), grade 2/3 bronchopulmonary dysplasia, stage 2-5 retinopathy of prematurity, retinopathy of prematurity receiving treatment, patent ductus arteriosus receiving treatment, medical or surgical necrotizing enterocolitis, intestinal perforation, grade 3/4 intraventricular hemorrhage, total days on antibiotics after DOL3, and postnatal corticosteroid use. Mean growth velocity for White was used as the reference.
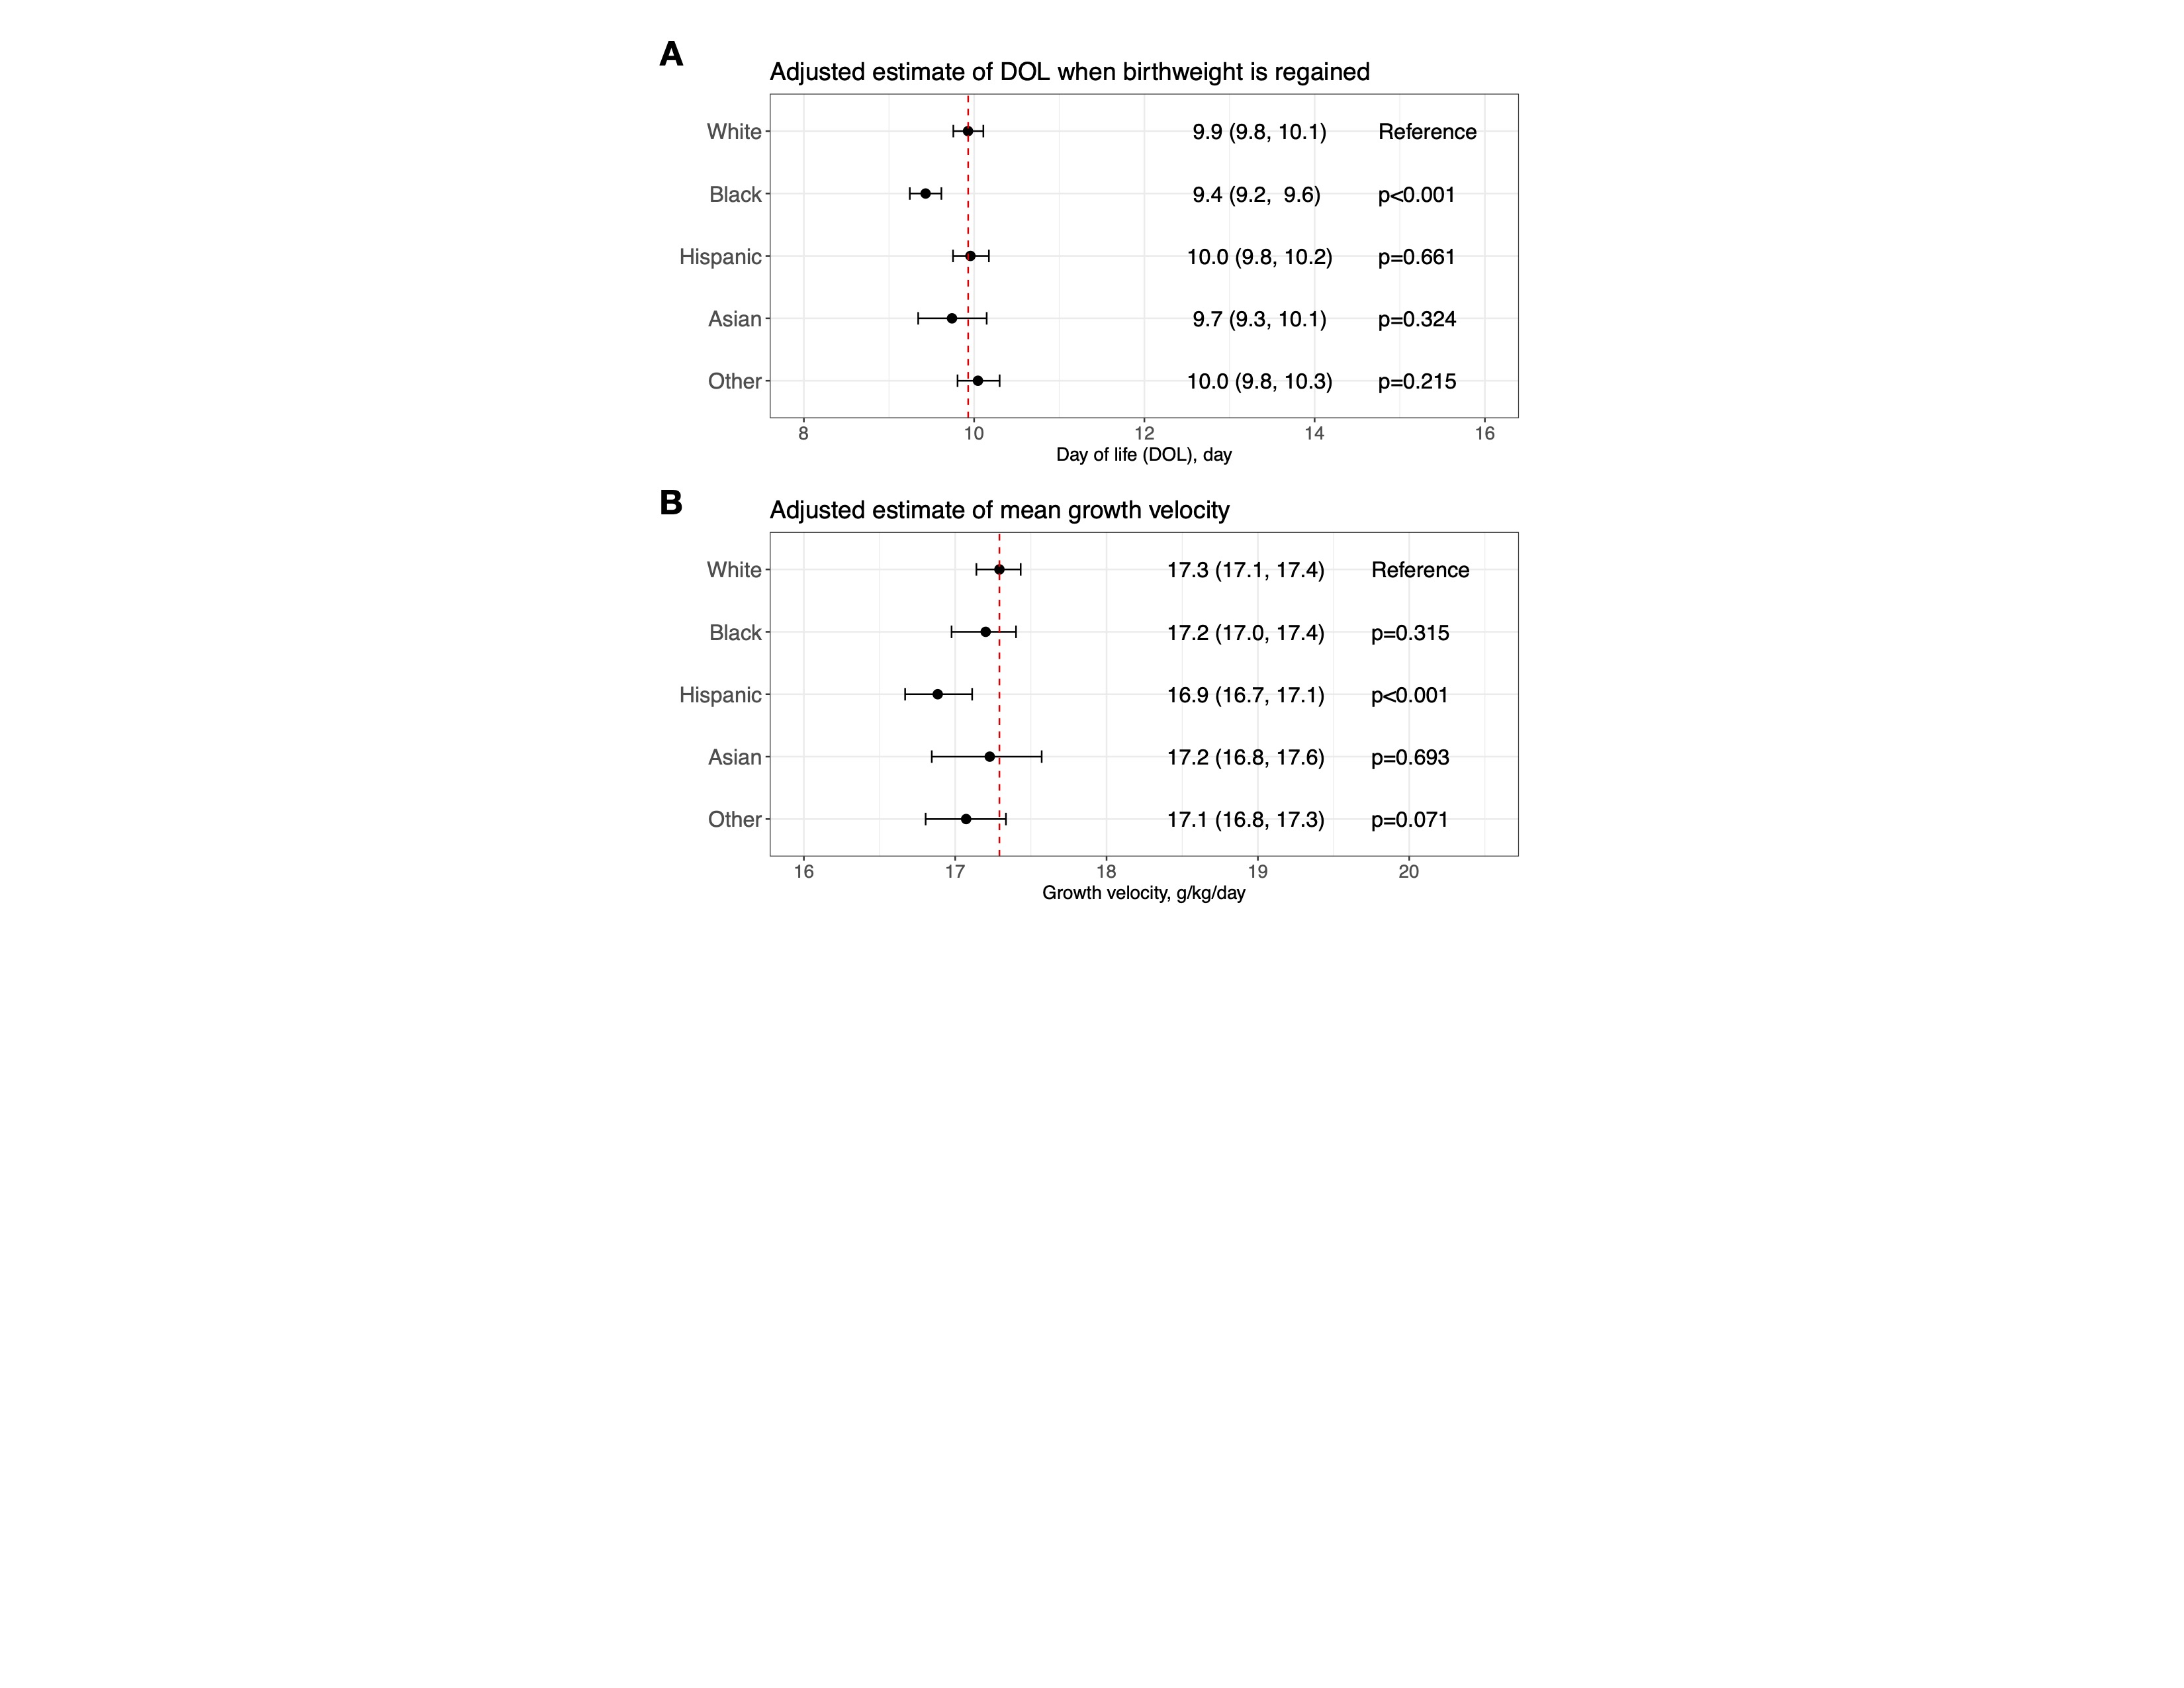 (A) Re-analysis of Figure 2B, using birth weight z-scores calculated from intrauterine growth charts for White infants as a confounder. (B) Re-analysis of Figure 2C, using birth weight z-scores calculated from intrauterine growth charts for White infants as a confounder. The rationale for using intrauterine growth charts for White to calculate birth weight z-scores for adjusting in these re-analyses is to treat birth weight z-scores as a confounder.(A) A diagram showing the inclusion and exclusion criteria for each aim, along with the number of infants before and after applying inverse propensity score weighting. Confounders balanced include maternal age, gestational age, sex, maternal obesity, hypertensive disorders of pregnancy, fetal growth restriction, maternal smoking during pregnancy, placental abruption, gestational diabetes, chorioamnionitis, and congenital anomalies. Propensity scores were derived using generalized boosted regression modeling to estimate the population average treatment effect. (B) Maternal and neonatal characteristics of the unweighted cohort. (C) Maternal and neonatal characteristics of the weighted population.(A) A mixed-effects model was developed to assess racial and ethnic disparities in birth weight z-scores based on the entire weighted population shown in Figure 1C. The birth weight z-scores were calculated using intrauterine growth charts developed for White infants as part of this study. White was used as the reference. (B) A mixed-effects model was developed to assess racial and ethnic disparities in time-to-birth-weight-regain, based on a weighted subpopulation of infants who regained their birth weight by day of life (DOL) 27 (Figure 1A). The model was adjusted for APGAR scores at 1 and 5 minutes and birth weight z-scores, calculated using race/ethnicity-specific intrauterine growth charts developed for this study (for adjusting within each racial/ethnic group). Time-to-birth-weight-regain for White was used as the reference. (C) A mixed-effects model was developed to assess racial and ethnic disparities in mean growth velocity, using a weighted subpopulation of infants with a weight nadir by DOL10 and birth weight regained by DOL27 (Figure 1A). Mean growth velocity was calculated based on daily weight measurements from DOL10 to the last recorded weight between 33-34 weeks postmenstrual age. The model was adjusted for several covariates: APGAR scores at 1 and 5 minutes, birth weight z-scores (calculated using race/ethnicity-specific intrauterine growth charts developed for this study), grade 2/3 bronchopulmonary dysplasia, stage 2-5 retinopathy of prematurity, retinopathy of prematurity receiving treatment, patent ductus arteriosus receiving treatment, medical or surgical necrotizing enterocolitis, intestinal perforation, grade 3/4 intraventricular hemorrhage, total days on antibiotics after DOL3, and postnatal corticosteroid use. Mean growth velocity for White was used as the reference.(A) Re-analysis of Figure 2B, using birth weight z-scores calculated from intrauterine growth charts for White infants as a confounder. (B) Re-analysis of Figure 2C, using birth weight z-scores calculated from intrauterine growth charts for White infants as a confounder. The rationale for using intrauterine growth charts for White to calculate birth weight z-scores for adjusting in these re-analyses is to treat birth weight z-scores as a confounder.