491 - Proof-of-Concept: A highly customizable, open-source dashboard for visualizing and analyzing real-time PICU bedside monitor data.
Monday, April 28, 2025
7:00am – 9:15am HST
Publication Number: 491.6433
Sarah K. Nutman, UPMC Childrens Hospital of Pittsburgh, Pittsburgh, PA, United States; Mohammed A. Shaik, UPMC Children's Hospital of Pittsburgh, Pittsburgh, PA, United States; Robert Clark, UPMC Children's Hospital of Pittsburgh, Pittsburgh, PA, United States; Christopher M. Horvat, UPMC/University of Pittsburgh, Pittsburgh, PA, United States
Pediatric Critical Care Fellow UPMC Childrens Hospital of Pittsburgh Pittsburgh, Pennsylvania, United States
Background: Early detection of changes in a patient’s clinical course can help prevent deterioration. These changes may be subtle and require synthesis of large amounts of data, often including highly dynamic data, such as that generated by bedside monitors and mechanical ventilators. Although individual machines may have mechanisms to review recent data, they often require viewing at the machine or at a single centralized location and do not efficiently facilitate interpretation of data or synthesizing it with other clinical assessments. Commercially available data aggregators exist but require significant additional investment in data infrastructure and hardware to create appropriate data pipelines. In addition, many existing dashboards require significant computing time and are not customizable to the needs of individual providers or groups. Objective: To create a prototype of a customizable, open-source dashboard that utilizes existing data streams to display and analyze real-time bedside monitor data in the pediatric intensive care unit (PICU). Design/Methods: Real-time patient physiological data from GE monitors in a quaternary care PICU is continuously archived by BedMasterEx as part of an existing data stream. XML data containing vital sign information from these archived files are periodically streamed to an open-source database optimized for efficient storage and rapid retrieval of physiological data (AtriumDB). A Python SDK is used to retrieve data, which is processed and displayed in a custom-built R Shiny dashboard. Results: We successfully developed a prototype of an open-source dashboard to visualize real-time PICU bedside monitor data (Figure 1). The dashboard allows for easy visualization of vital sign excursions over time and is highly customizable, both at the development level and for the end-user. On a locally accessible drive, the dashboard also had improvements in processing speed when compared to the commercially available BedMasterEx vital sign dashboard and a customized Cerner CareAware iAware dashboard that shows electronic health record data. However, some challenges were identified, including delays in streaming archival data to the open-source database.
Conclusion(s): Open-source dashboards that utilize existing data streams of real-time PICU data offer a viable solution for improving visualization, analysis, and interpretation of clinical information for critically ill patients.
Figure 1: Clinical Data Dashboard 
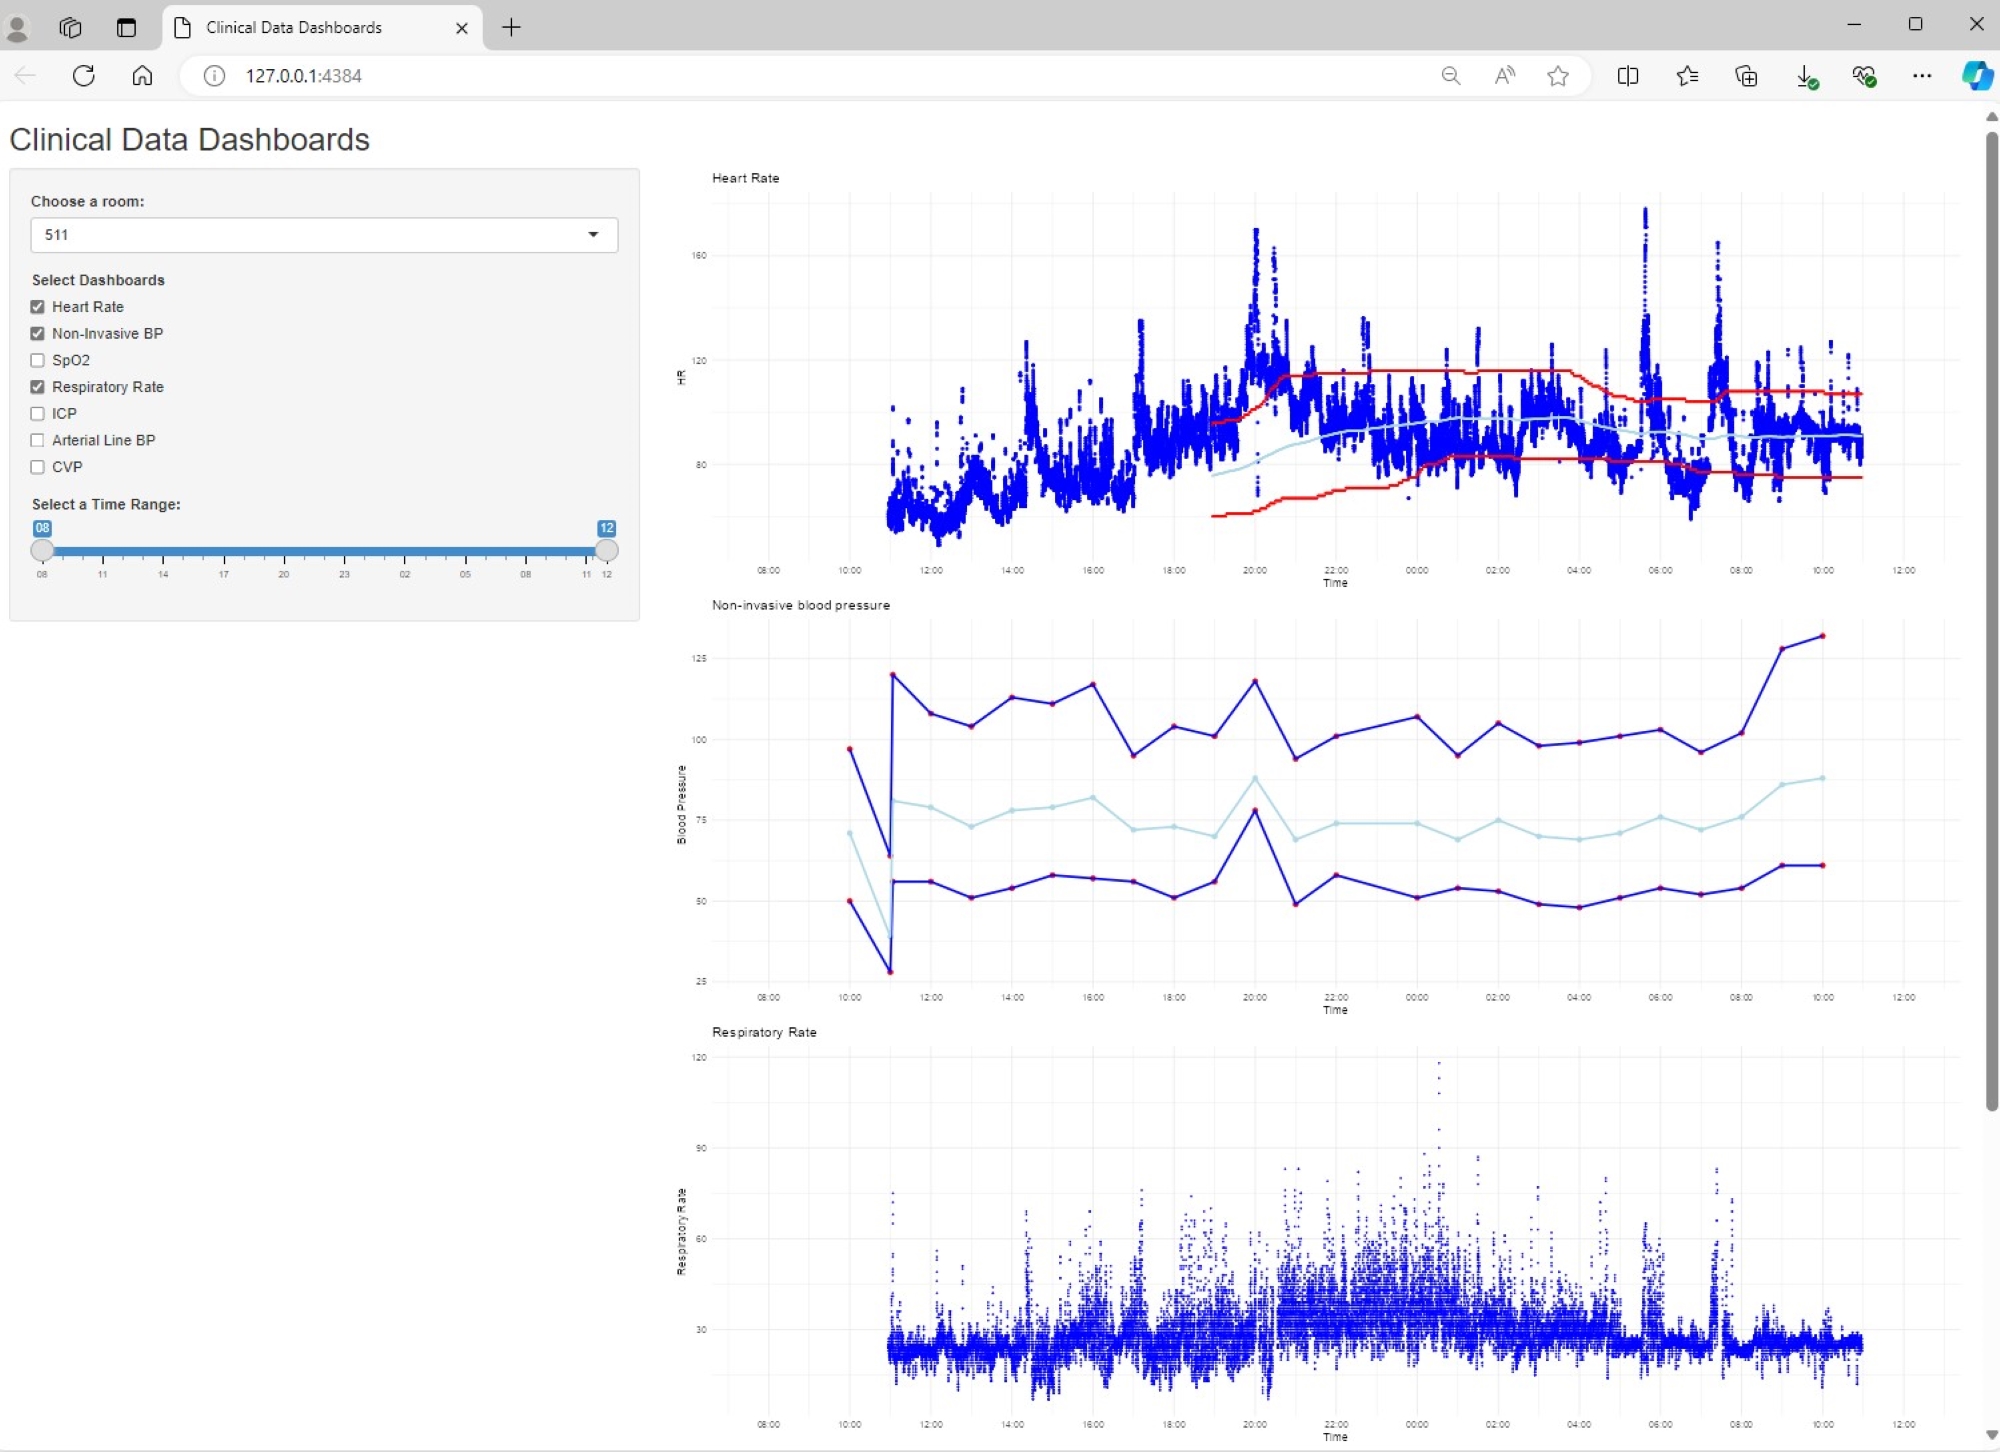
Clinical data dashboard prototype that shows up to 24 hours of bedside monitor data and highlights heart rate excursions with rolling averages, 90th, and 10th percentiles.