
Technology 4
Session: Technology 4

Anna Trivillin, MD
Neonatologist
University of Padova: Department of Women' and Children Health
Padova, Veneto, Italy
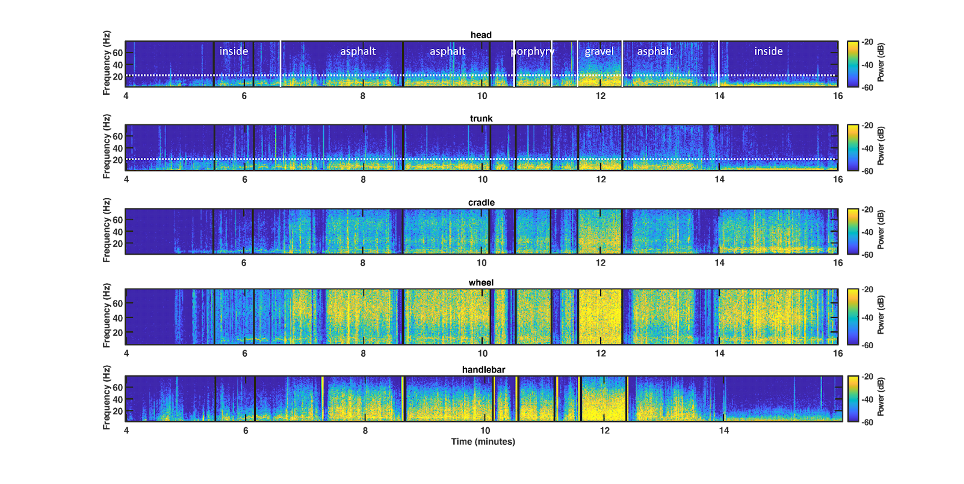 The x-axis represents the time in min, the y-axis the frequencies in Hz. The power of the vibrations is represented by a color code, blue for 0 and yellow for the maximum value recorded. In the first panel the different types of terrain are highlighted in white. In the first and second panels, the 20 Hz threshold is represented by a dashed white line.