
Genomics/Epigenomics 1
Session: Genomics/Epigenomics 1
Tomi Pastinen, MD PhD (he/him/his)
Director of Genomic Medicine Center
Children s Mercy Hospitals and Clinics
Kansas City, Missouri, United States
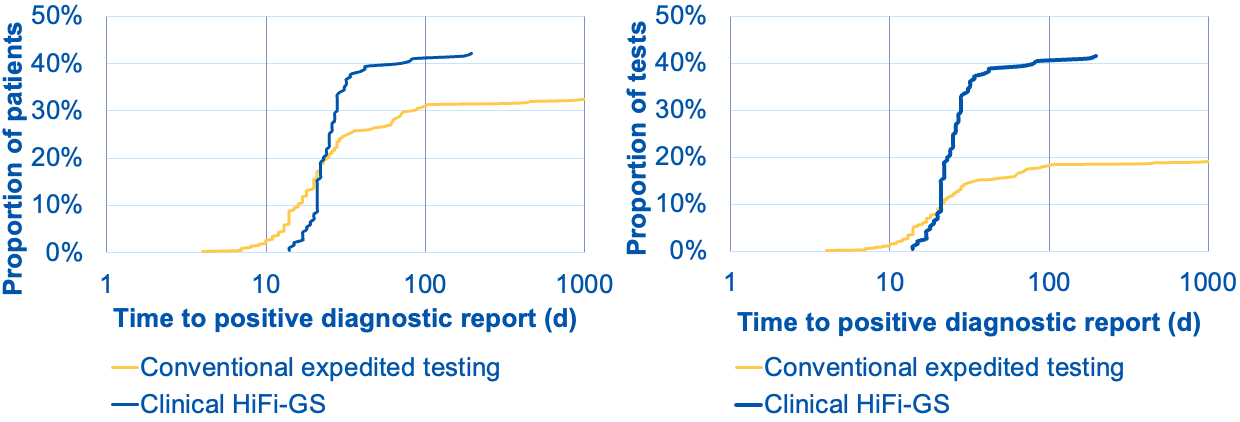 Left graph shows cumulative distribution of positive diagnoses (pathogenic variants returned in EMR) as fraction of patients tested (Y-axis) over turnaround time from order to diagnostic report (X-axis). The blue curve shows the clinical HiFi-GS test, whereas the the yellow curve represents traditional testing consisting of various combinations of clinical microarray (CMA), clinical exome, cytogenetic (FISH) and panel (gene panels and specific tests for complex genes, repeat expansions or methylation). HiFi-GS yields higher diagnostic rate (42 vs. 32%) and on average the overall testing process is shorter: conventional testing can continue by reflex follow-up tests for months. The right graph shows the rate of diagnosis as a fraction of independent molecular tests ordered, where the conventional testing required nearly twice as many tests (e.g. panel + CMA or exome +FISH, etc.) number of tests to reach lower diagnostic ceiling translating to less than 1/2 of overall diagnostic yield per test as compared to clinical HiFi-GS.