
Neonatal Pulmonology - Basic/Translational Science 2
Session: Neonatal Pulmonology - Basic/Translational Science 2
 photo")
Yu-Shan Chang, MD, PhD (she/her/hers)
Attending physician
Chi Mei Medical Center
Tainan, Tainan, Taiwan (Republic of China)
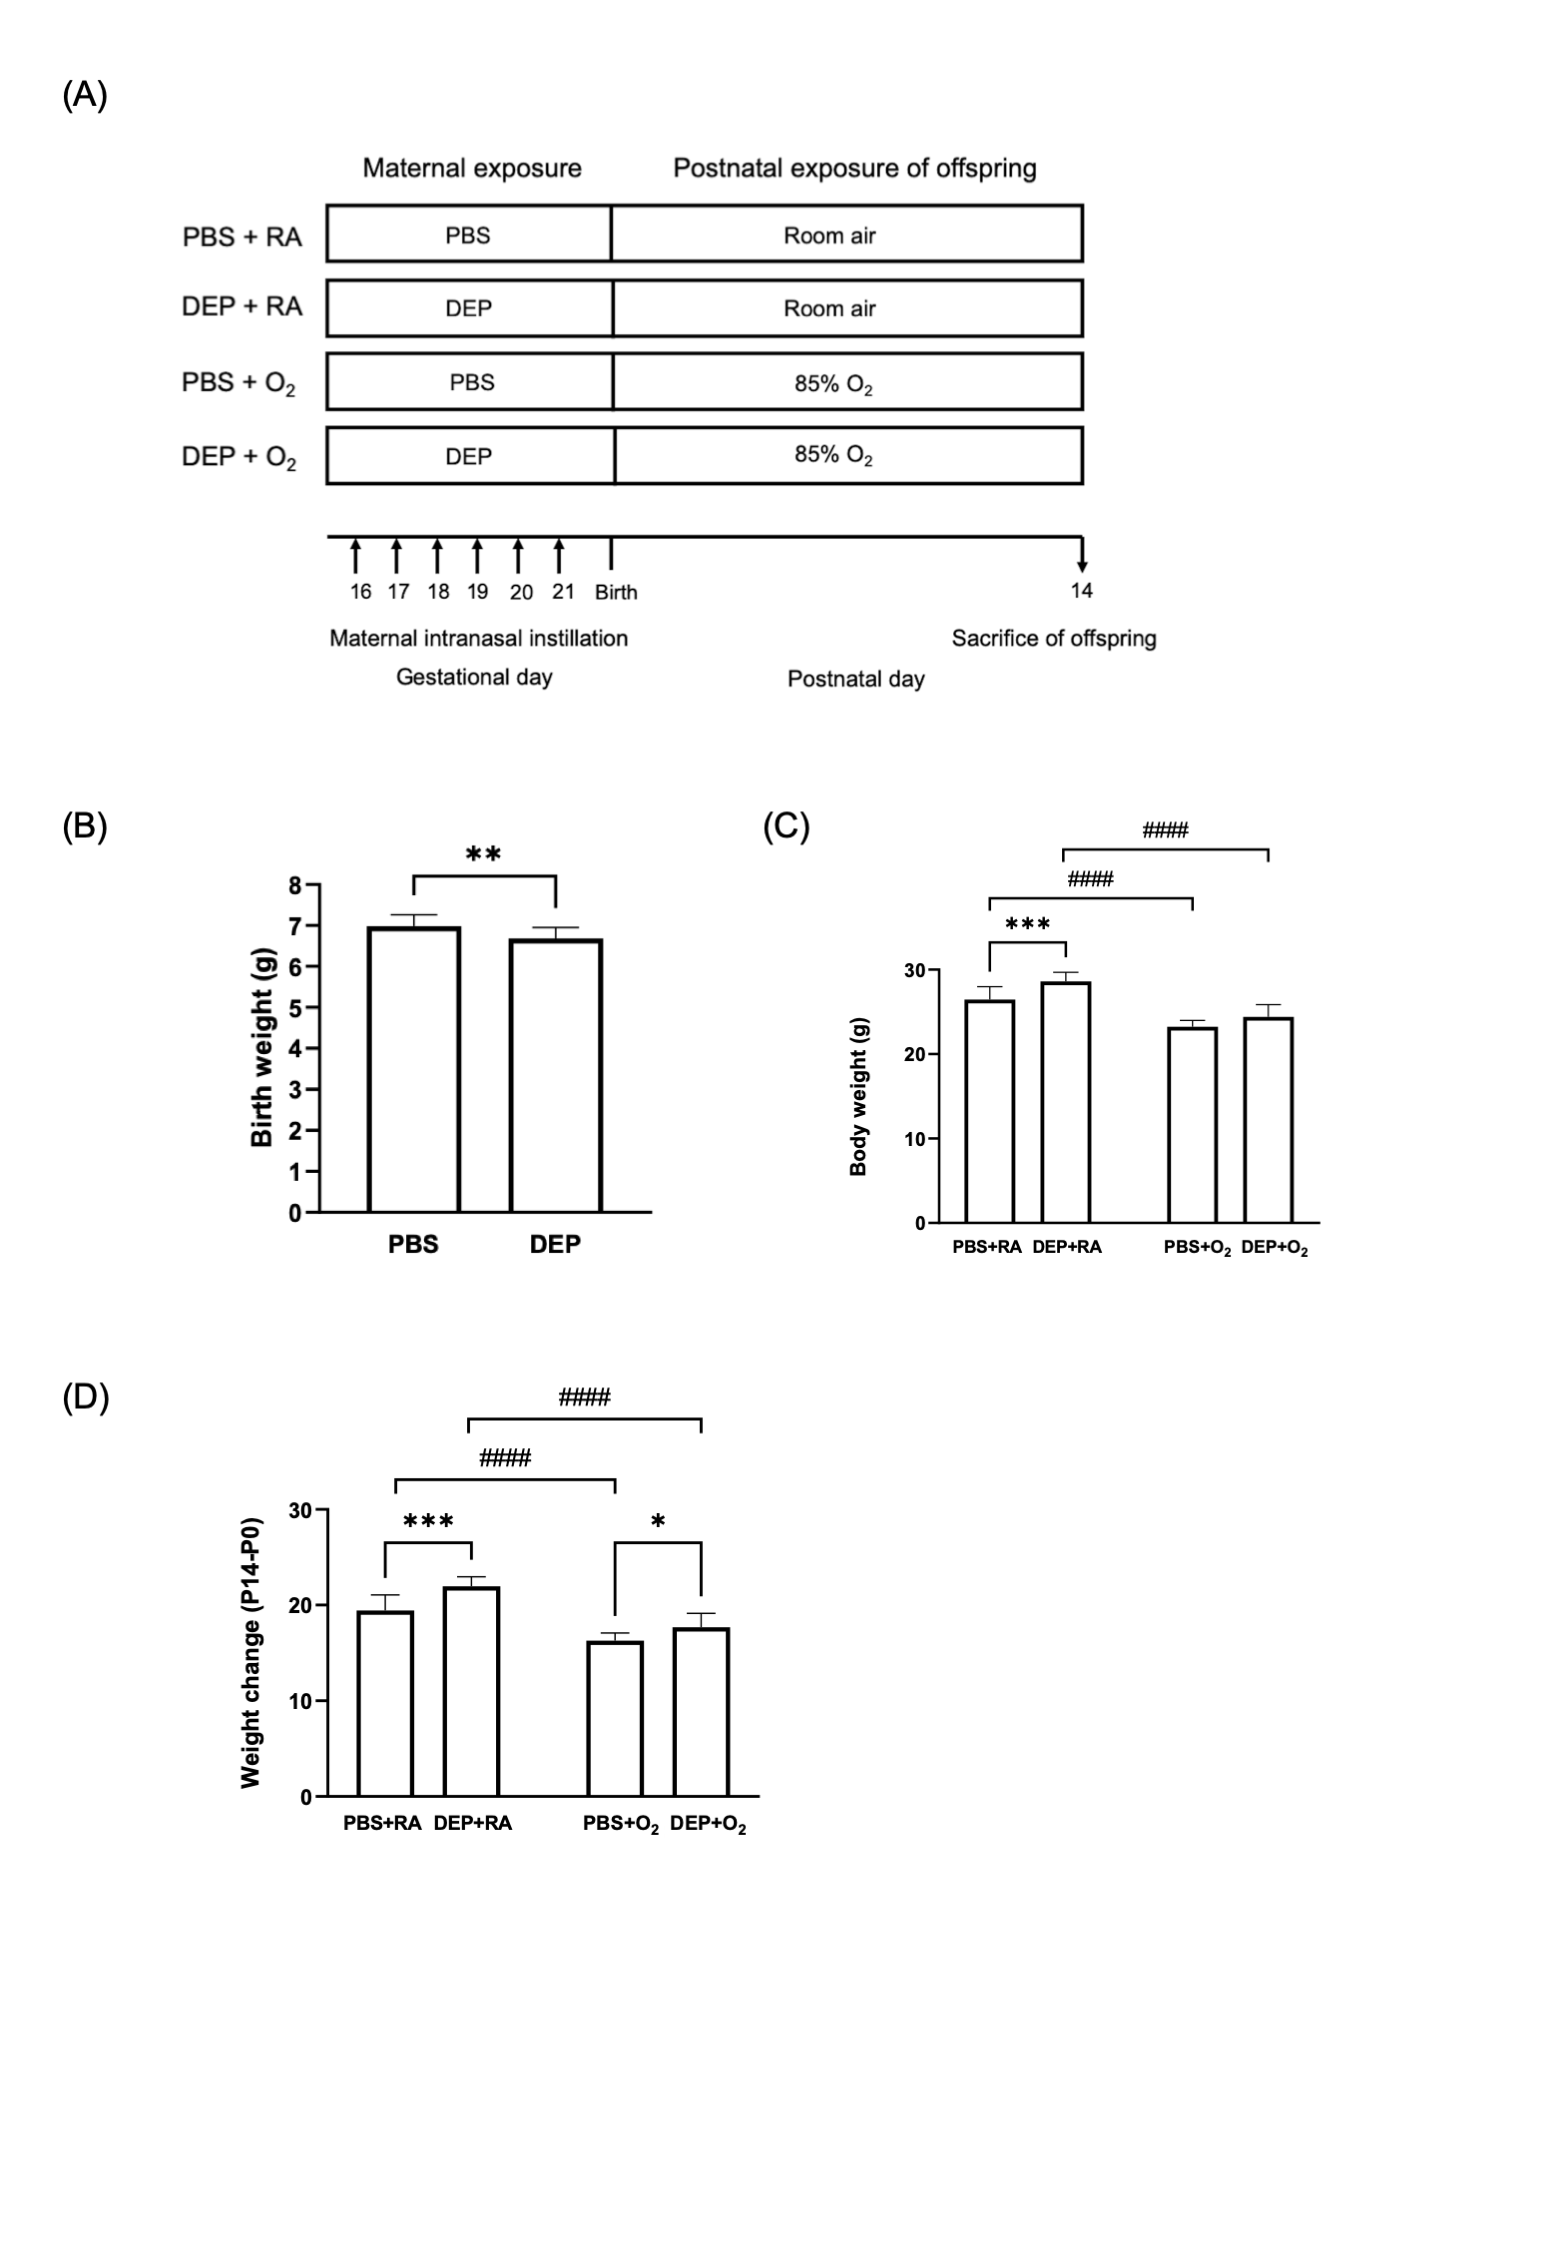 (A) Diagrammatic representation of the experimental design (B) Birthweight of offspring rats born to DEP-exposed and control (PBS) dams (C) Body weight of offspring rats at P14. (D) Weight changes (P14-P0) of offspring rats. The data are expressed as mean ± SD. * p < 0.05, ** p < 0.01, *** p < 0.001, **** p < 0.0001, #### p < 0.0001
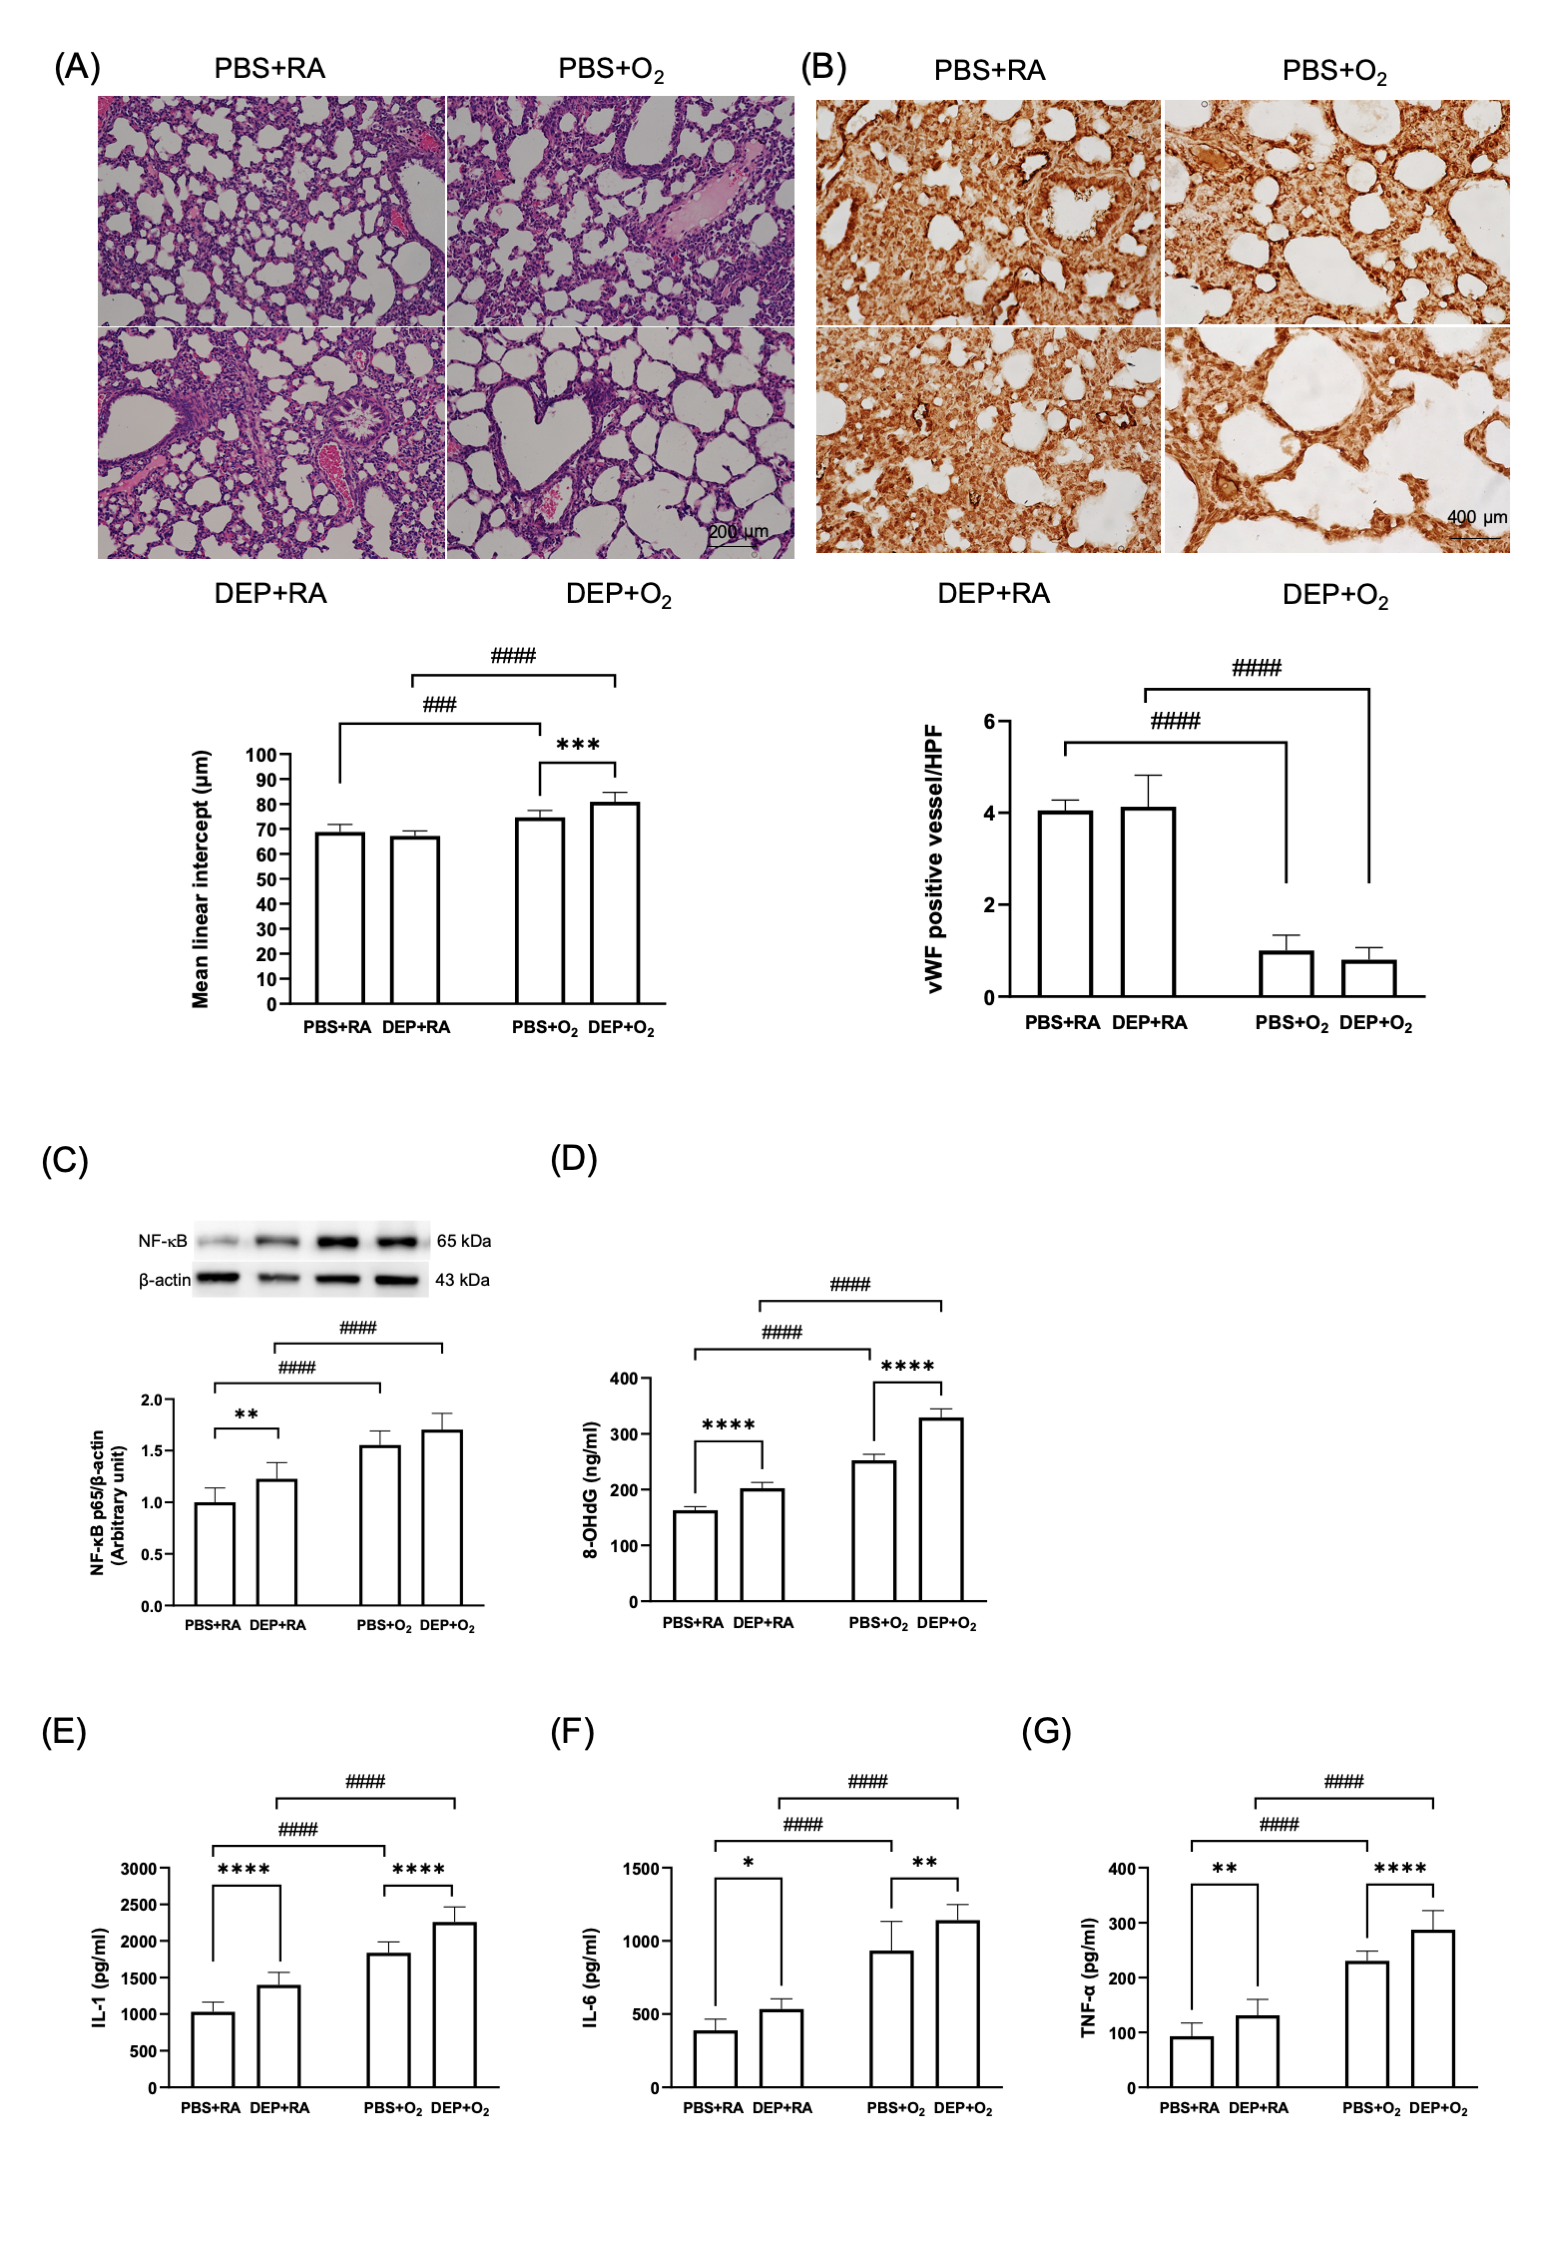 (A) Representative images of H&E stain of lung sections and quantification of mean linear intercept lengths. (B) vWF immunohistochemical stain (dark brown stain, indicated by arrows) of the lung and quantitative comparison of vWF expression. (C) Western blots of NF-kB protein and quantified results (D) 8-OHG level. Quantification of inflammatory cytokine levels including (E) IL-1, (F) IL-6 and (G) TNF-a. Data are expressed as mean ± SD. * p < 0.05, ** p < 0.01, *** p< 0.001, **** p < 0.0001, ### p < 0.001, #### p < 0.0001
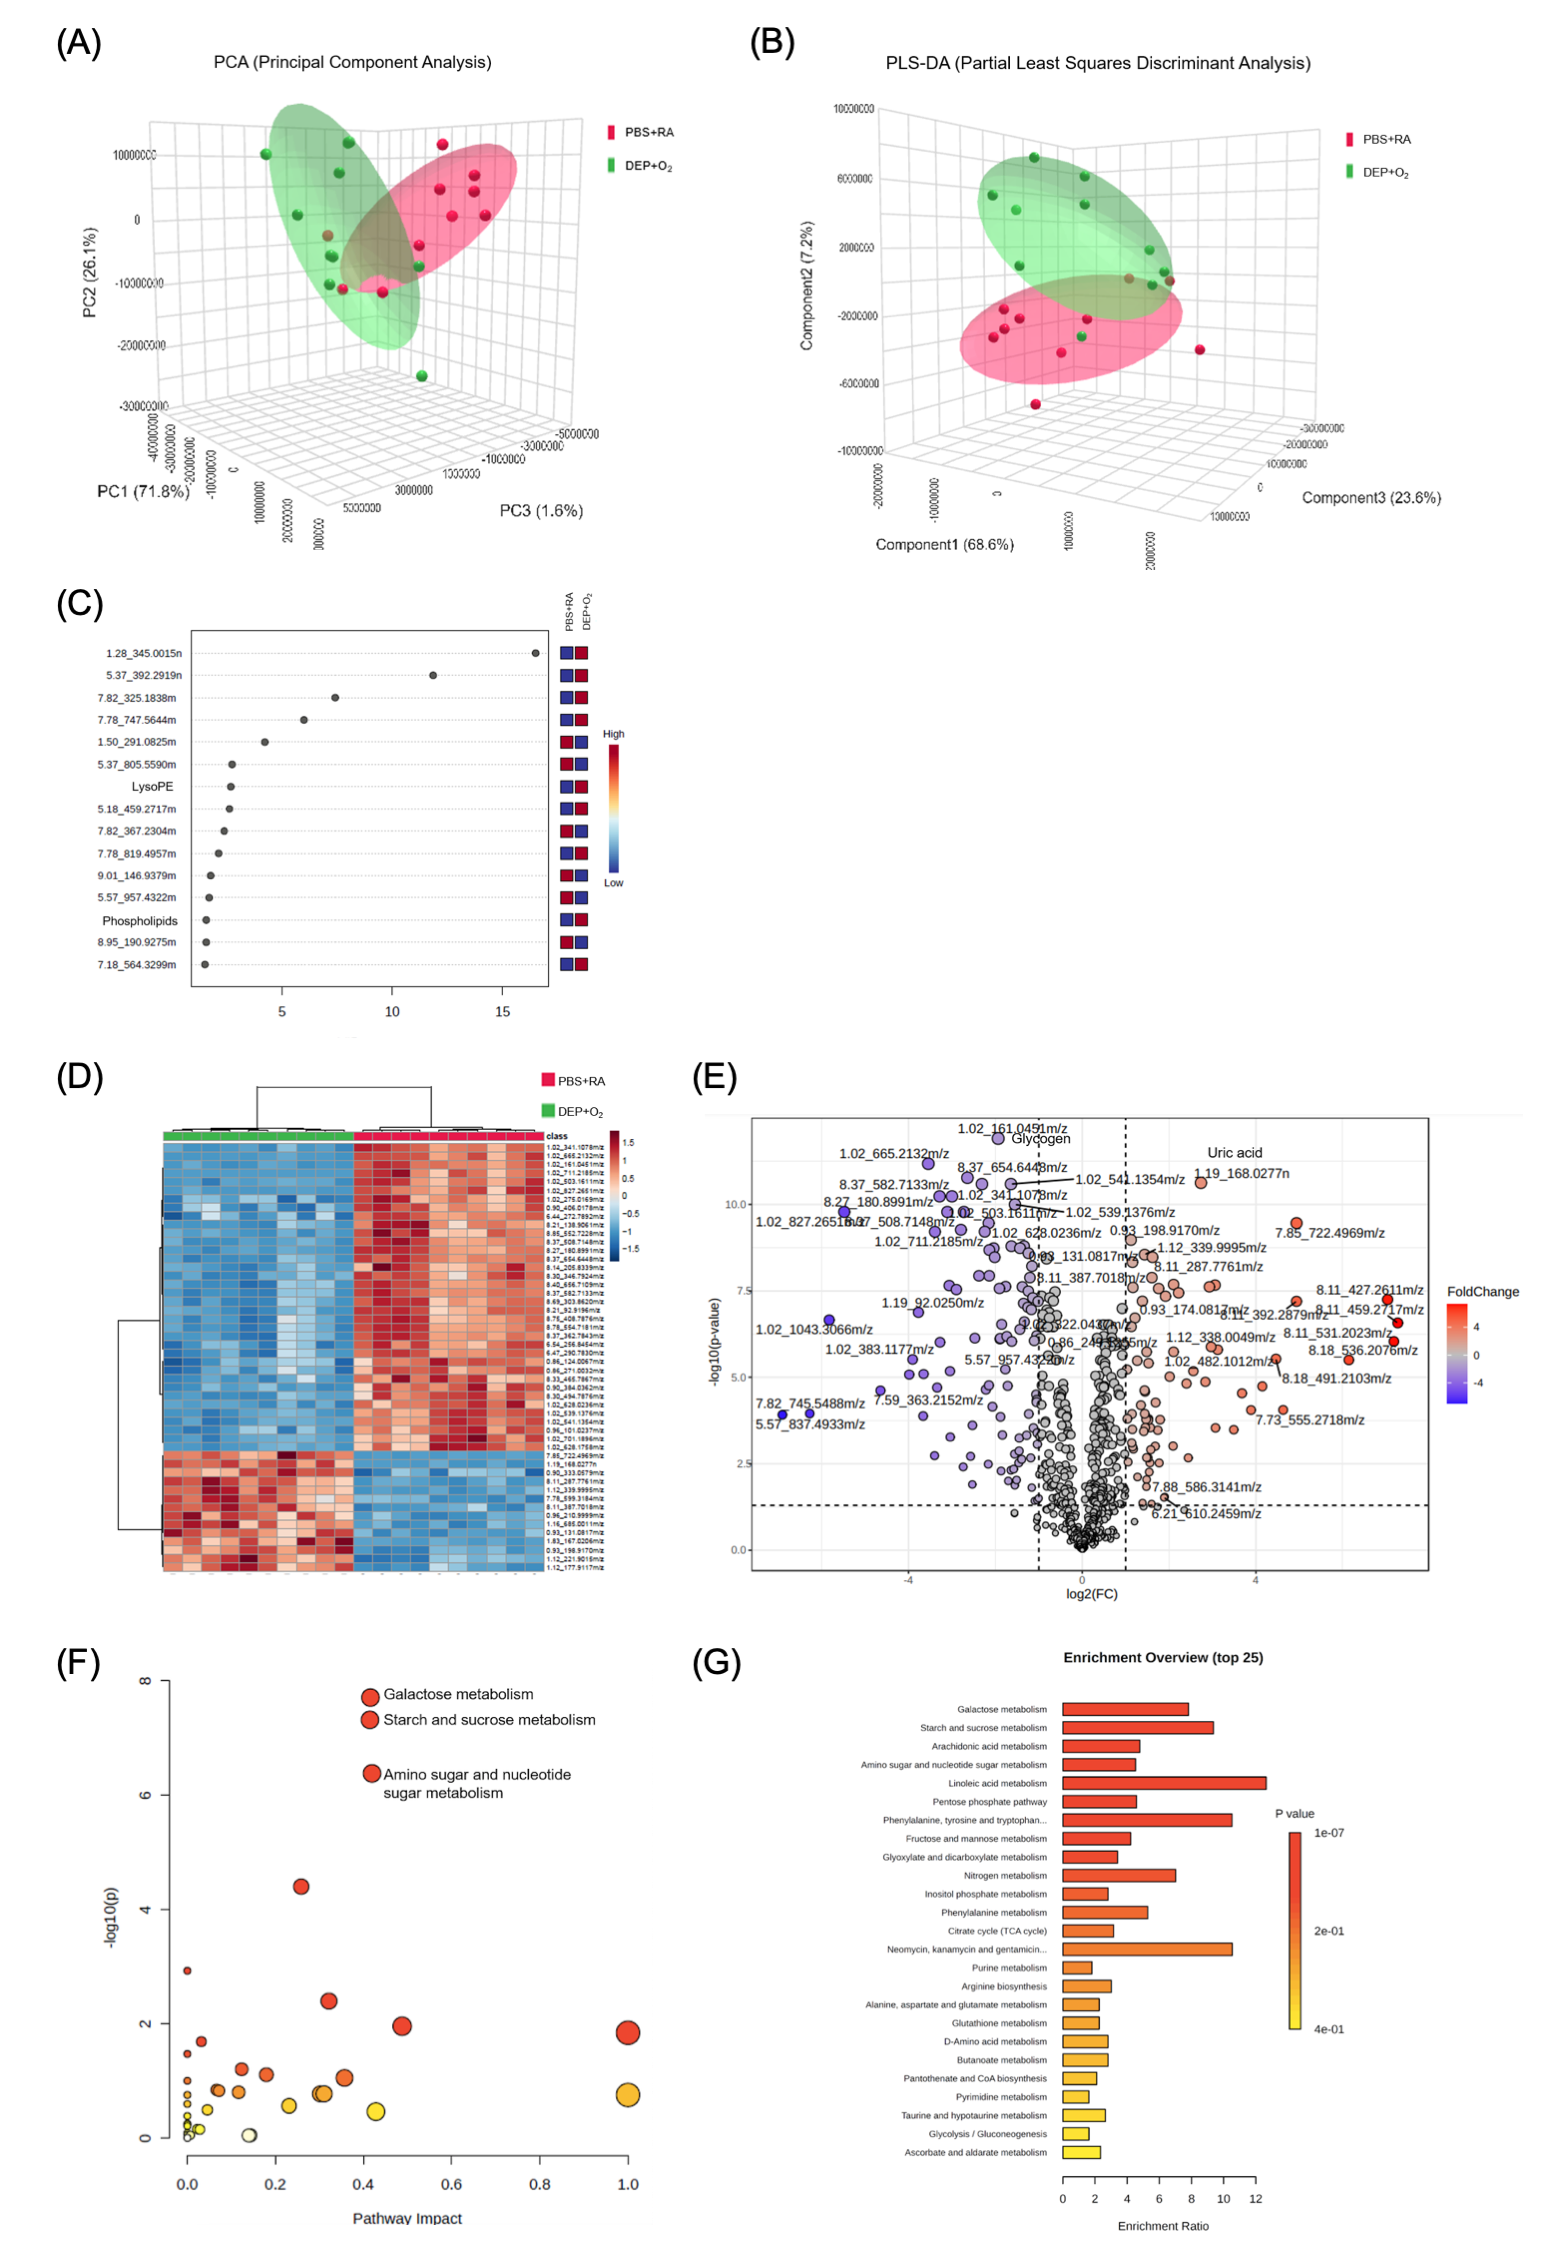 (A) Three-dimensional score plots from principal component analysis (PCA). (B) Partial least-squares discriminant analysis (PLS-DA) score plots for samples collected on postnatal day 14. Red circles represent the PBS+RA group, while green circles indicate the DEP+O2 group. (C) The compounds shown in the variable importance in projection scores are listed based on their ranking following false discovery rate adjustment for univariate analysis. The top 15 compounds that most significantly contributed to group differentiation were identified via PLS-DA and ordered by their variable importance in projection scores. The heatmap on the right illustrates the average intensities across the groups, where red indicates elevated metabolite levels and blue indicates reduced levels (n = 10). (D) Hierarchical clustering analysis. This analysis identified two distinct clusters that separate the PBS+RA and DEP+O2 groups in the lung. Clustering was conducted using Euclidean distance and Ward's linkage method. (E) Volcano plots illustrating the data from ultraperformance liquid chromatography–mass spectrometry (MS)/MS. The y-axis shows −log(p) values, while the x-axis represents log2 (fold change). Metabolites with significant alterations (fold change > 2, p < 0.05) are marked in blue and red, with gray dots indicating nonsignificant metabolites. (n = 10). Enrichment of metabolic pathways in the lungs of DEP+O2 rats displayed with (F) Bubble plot and (G) Bar chart, highlighting the metabolic pathways impacted in the DEP+O2 rat lungs on postnatal day 14 (n = 10).