
Neonatal General 4: Novel Technology and Therapies
Session: Neonatal General 4: Novel Technology and Therapies
 photo")
Eva B. Senechal, BSc. (she/her/hers)
PhD. Candidate
McGill University Faculty of Medicine and Health Sciences
Montreal, Quebec, Canada
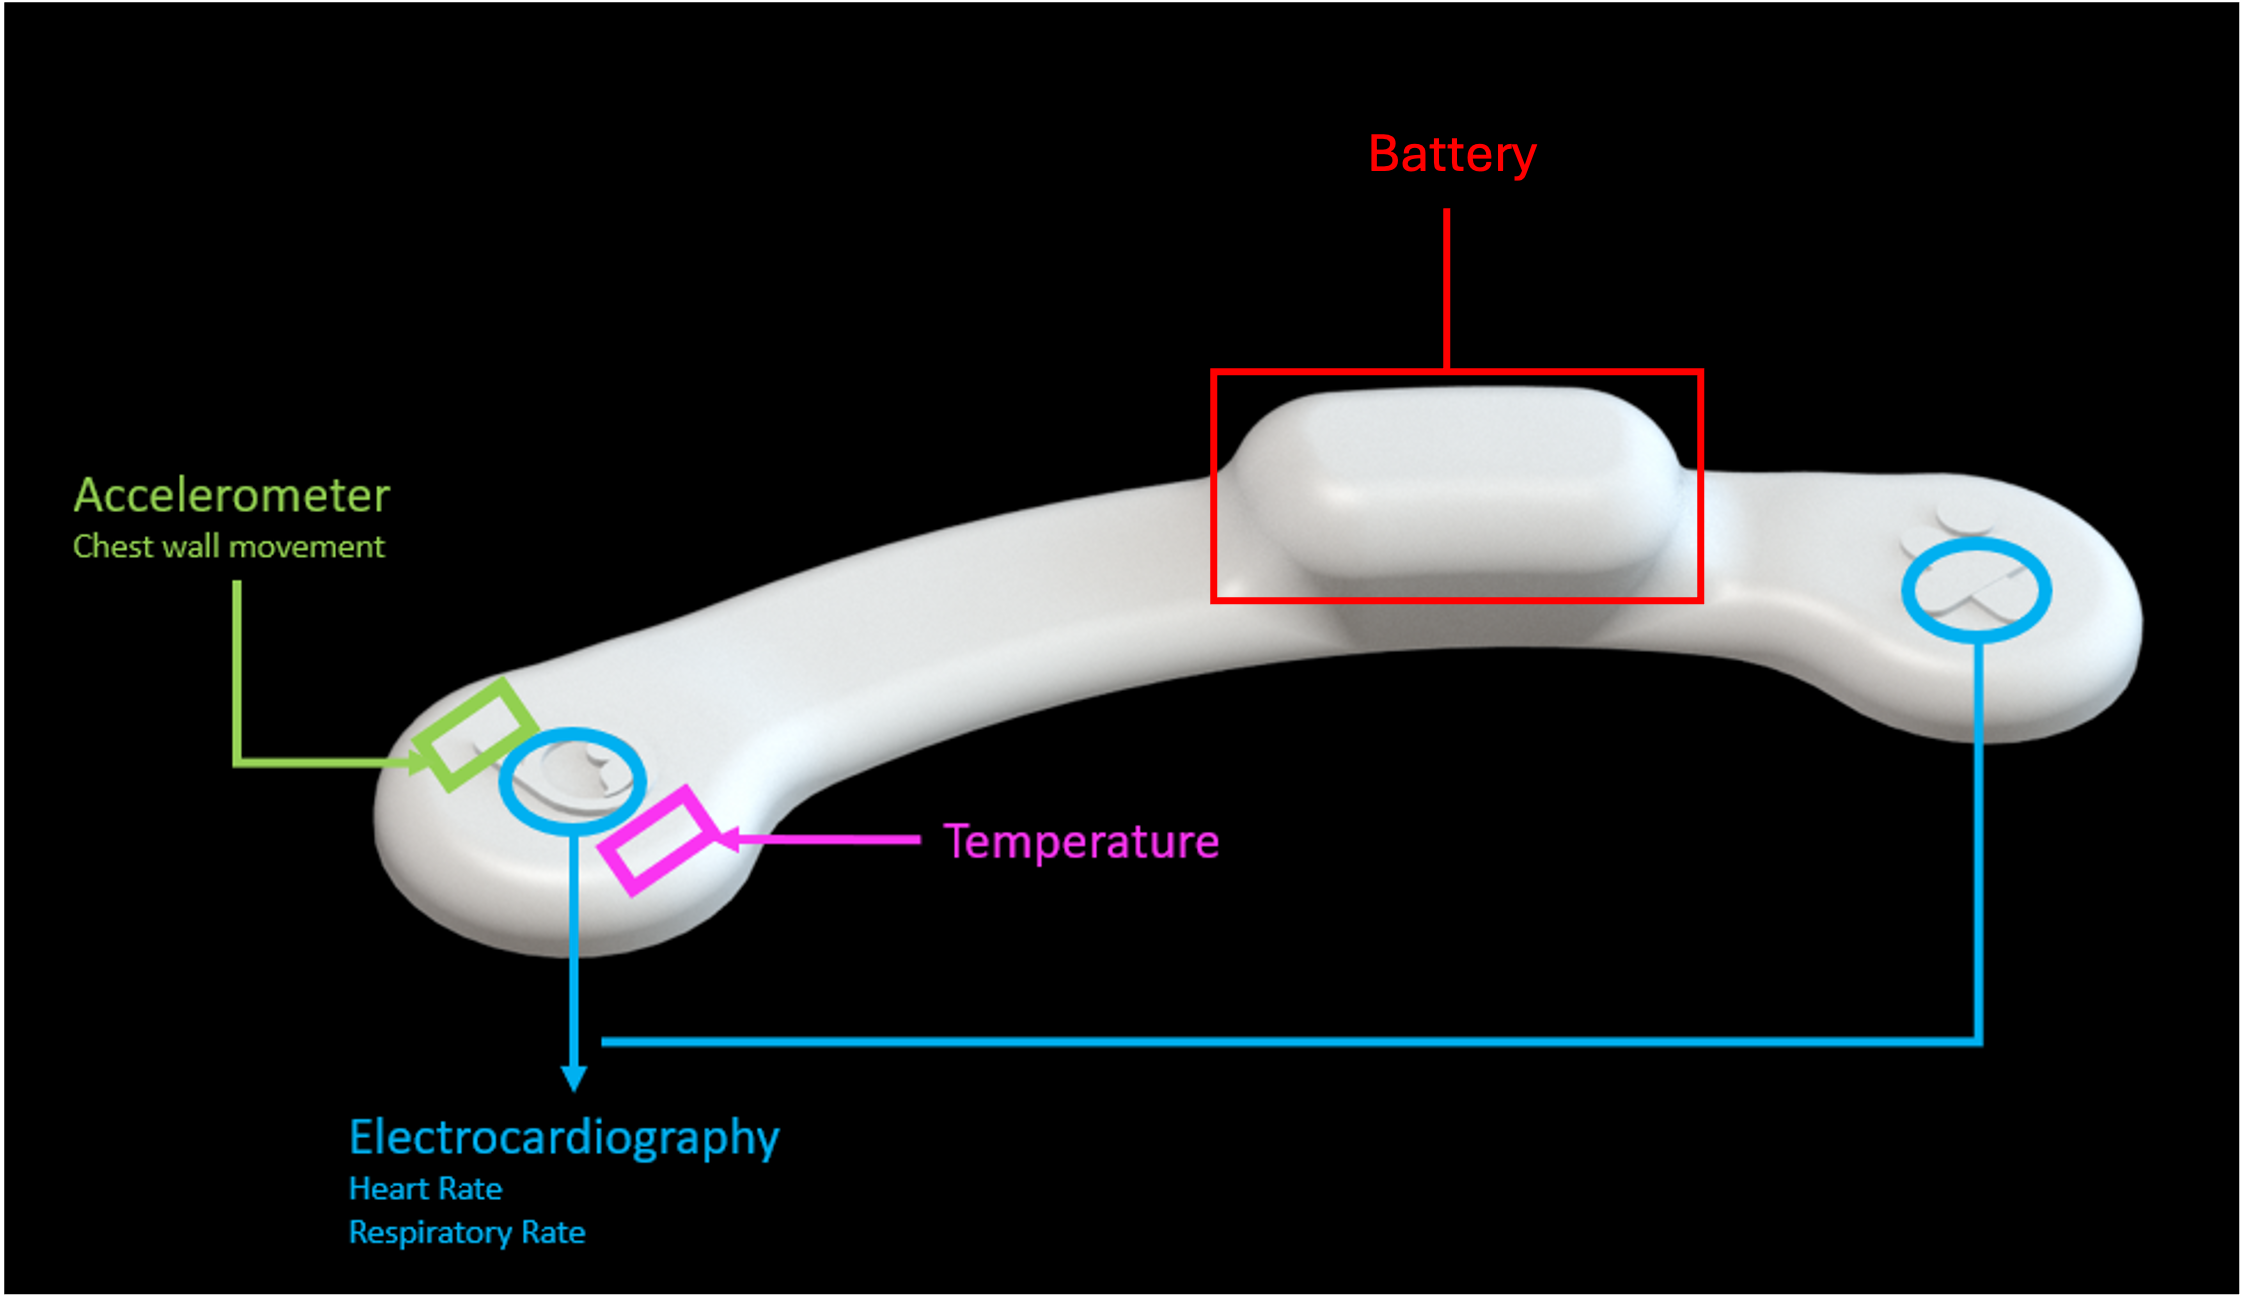 Legend: Diagram of the wireless skin sensors indicating the location of various sensors.
 .png) Legend: (A) Linear regression of one patient with the Pearson correlation coefficient, scale ratio (slope), and variance accounted for (vaf);(B) Bland Altman analysis for the same patient with the bias, 95% limits of agreement (LoA).
Legend: (A) Linear regression of one patient with the Pearson correlation coefficient, scale ratio (slope), and variance accounted for (vaf);(B) Bland Altman analysis for the same patient with the bias, 95% limits of agreement (LoA)..png) Legend: Clarke Error Grid with legend providing % of available data points in each zone. Zone definitions are provided in table below gird. Bradycardia defined as bpm <100, and high heart and Tachycardia defined as bpm > 180 Legend: Diagram of the wireless skin sensors indicating the location of various sensors. Legend: (A) Linear regression of one patient with the Pearson correlation coefficient, scale ratio (slope), and variance accounted for (vaf);(B) Bland Altman analysis for the same patient with the bias, 95% limits of agreement (LoA).Legend: Clarke Error Grid with legend providing % of available data points in each zone. Zone definitions are provided in table below gird. Bradycardia defined as bpm <100, and high heart and Tachycardia defined as bpm > 180
Legend: Clarke Error Grid with legend providing % of available data points in each zone. Zone definitions are provided in table below gird. Bradycardia defined as bpm <100, and high heart and Tachycardia defined as bpm > 180 Legend: Diagram of the wireless skin sensors indicating the location of various sensors. Legend: (A) Linear regression of one patient with the Pearson correlation coefficient, scale ratio (slope), and variance accounted for (vaf);(B) Bland Altman analysis for the same patient with the bias, 95% limits of agreement (LoA).Legend: Clarke Error Grid with legend providing % of available data points in each zone. Zone definitions are provided in table below gird. Bradycardia defined as bpm <100, and high heart and Tachycardia defined as bpm > 180 