
Neonatal General 3: NICU Practices
Session: Neonatal General 3: NICU Practices
Scott P. Oltman, MS (he/him/his)
Epidemiologist
University of California, San Francisco, School of Medicine
San Francisco, California, United States
.png)
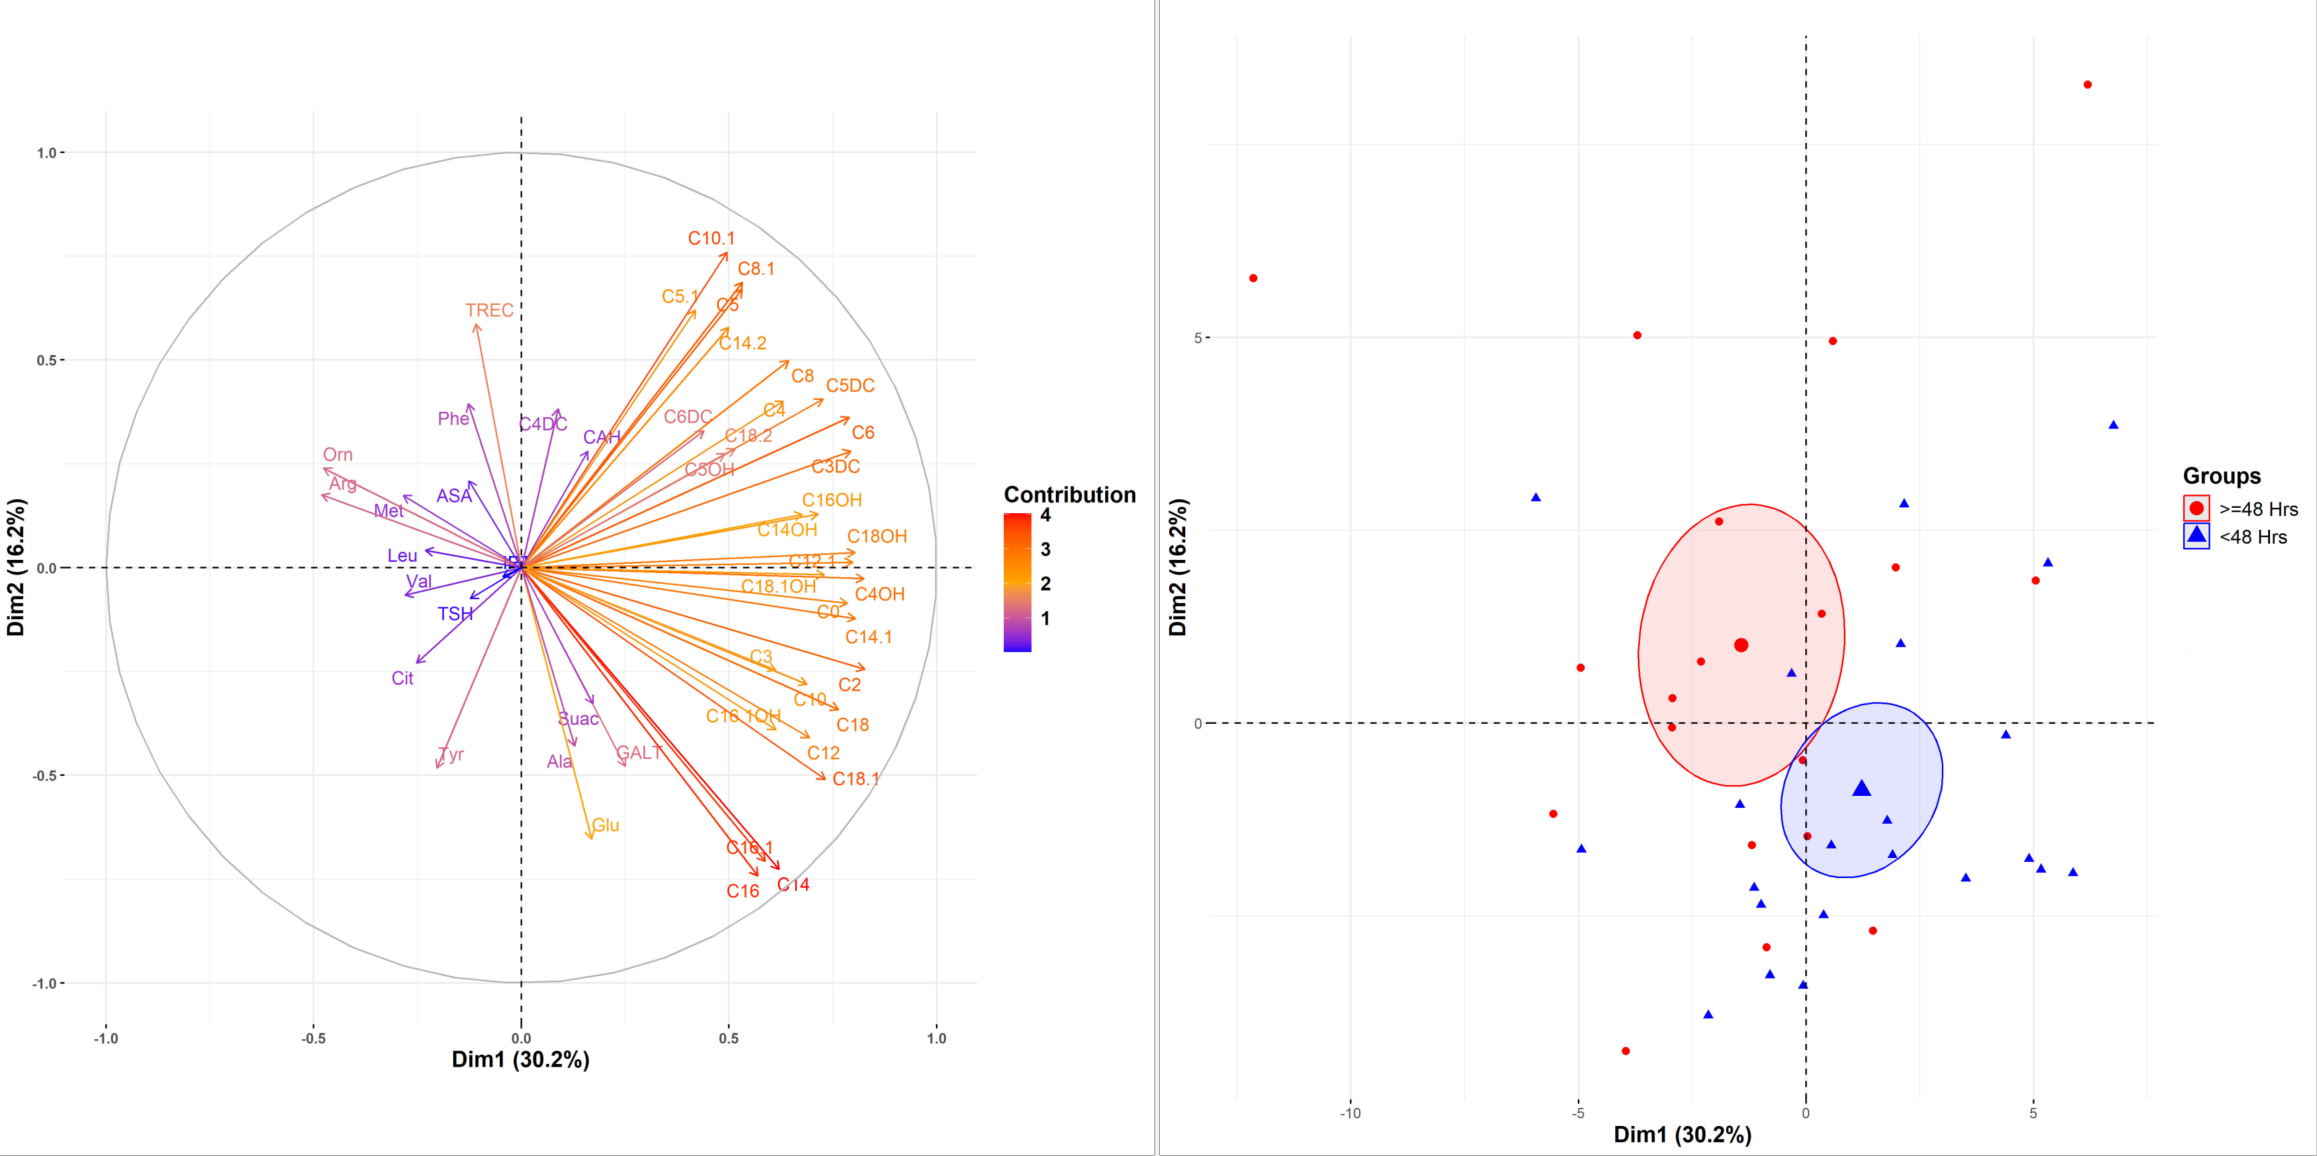 PCA of newborn metabolic patterns. Left plot: Metabolic markers' contribution to the variance in the data. The length of the arrows represents the contribution of each metabolic marker to the principal components, with color intensity indicating higher contributions. Right plot: individual samples categorized by timing of skin-to-skin care initiation (≥48 hours in red and <48 hours in blue). Individual points and their barycenters, with ellipses representing 95% confidence intervals for each group, highlighting the separation between groups based on their metabolic profiles.