
Neonatal Neurology 2
Session: Neonatal Neurology 2
 photo")
Carmen Monthe-Dreze, MD (she/her/hers)
Neonatologist/Instructor in Pediatrics
Brigham and Women's Hospital/Harvard Medical School
Boston, Massachusetts, United States
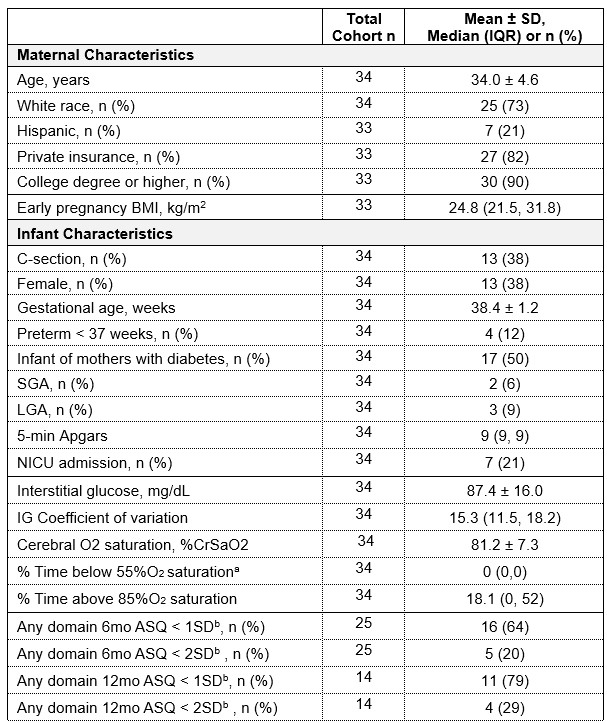 Data presented as mean ± SD for normally distributed variables, median (IQR) for non-normally
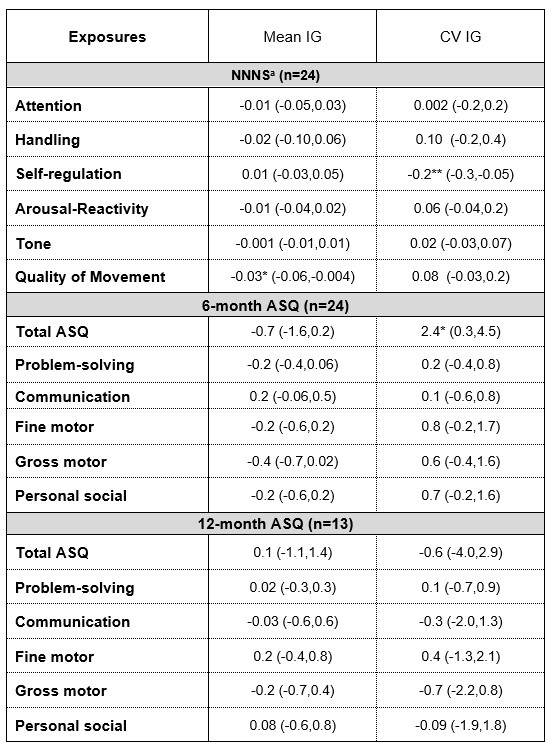 Data are reported as beta estimates (95%CI) from linear regression models adjusted
 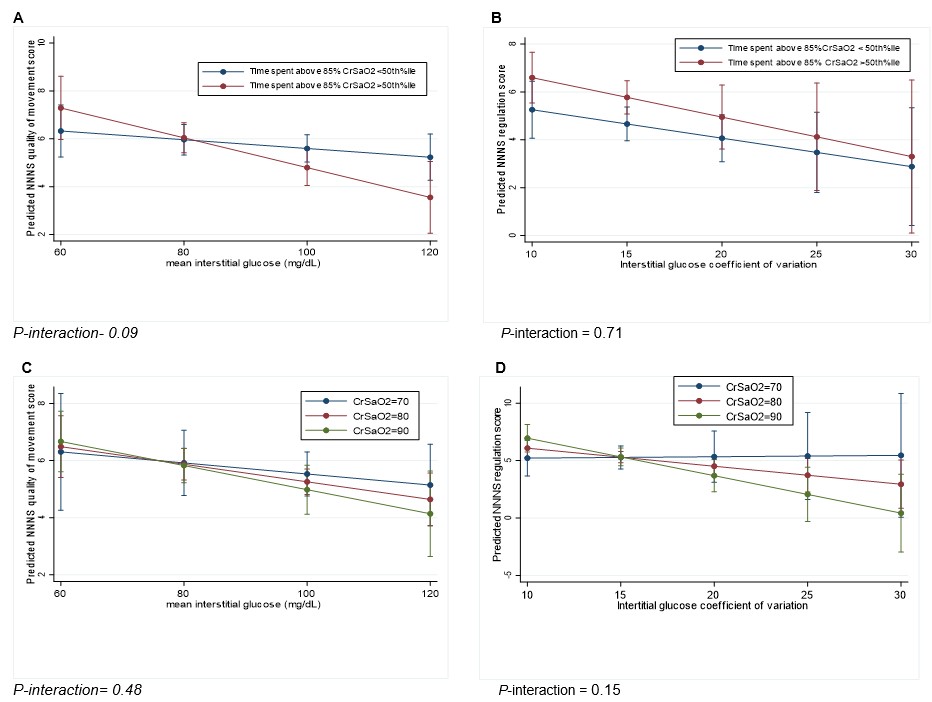 Results are displayed as estimated means with 95%CI from linear regression analyses adjusted for maternal BMI, gestational age and sex, and included a cNIRS measure*IG interaction term. Abbreviation: CrSaO2: Cerebral O2 saturation. Figures A and B: Associations between mean IG and NNNS quality of movement scores (A) and between IG coefficient of variation and NNNS regulation scores (B) stratified by %time CrSaO2 > 85%O2 category (above or below median). Figures C and D: Associations between mean IG and NNNS quality of movement scores (C) and between IG coefficient of variation and NNNS regulation scores (D) while holding CrSaO2 at three different values: 70, 80, and 90%. P-value for interaction was considered significant at P < 0.2.