
Neonatal Neurology 2
Session: Neonatal Neurology 2
 photo")
Maria E. Barnes-Davis, MD/PhD (she/her/hers)
Associate Professor and Attending Neonatologist
Cincinnati Children's Hospital Medical Center
Cincinnati, Ohio, United States
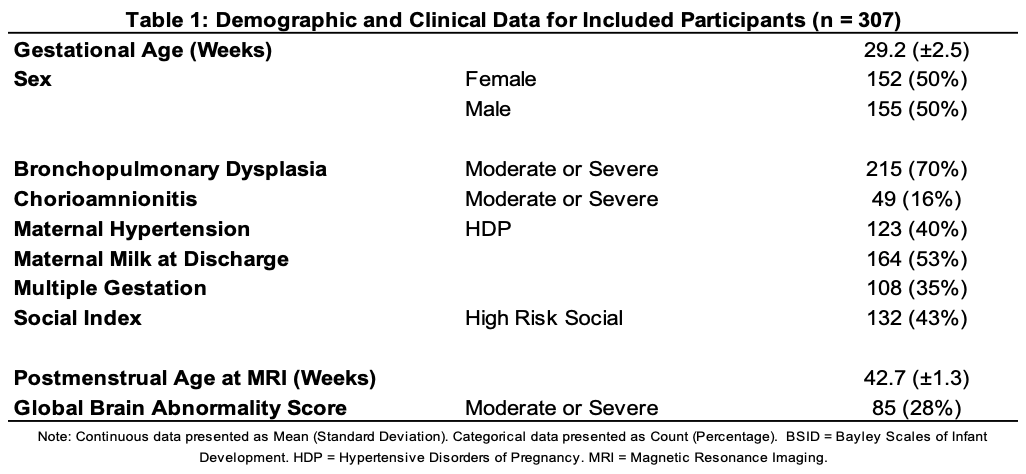
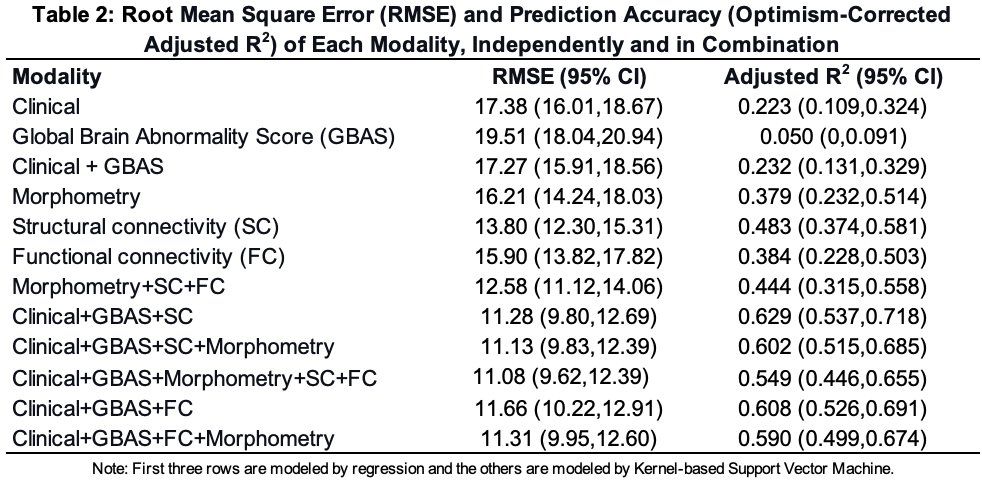
.png) A. Top 10 inputs across modalities for the kernel-based support vector machine (kSVM) are ranked by partial R squared (a measure of the variance accounted for by that input). High Risk Social Score indicates that a given participant scored as high risk on a social index comprised of family structure, education and employment of primary caregiver, household income, primary language, and maternal age. Maternal Milk at Discharge indicates that the infant received any maternal milk at time of discharge from the hospital, regardless of amount. GBAS is the Global Brain Abnormality Score published by Kidokoro et al, 2013. Moderate/Severe Chorioamnionitis was determined based on placental pathology. Morphometry Component 15 included the left temporal lobe, left superior temporal gyrus (STG), right fusiform, right posterior cingulate, right temporal lobe, right medial and inferior temporal gyri, bilateral occipital lobes, left fusiform, left insula, and the brainstem. Structural Connectivity Component 5 included the left parietal lobe, bilateral cingulate, right parietal lobe, bilateral medial and inferior temporal gyri, right fusiform, left STG, bilateral frontal lobe white matter, right parahippocampal gyrus, right STG, right insula, and the left fusiform. Morphometry Component 24 included the left fusiform, the left medial and inferior temporal gyri, the brainstem, the bilateral temporal lobes, the bilateral STG, and the hippocampi and amygdala.
A. Top 10 inputs across modalities for the kernel-based support vector machine (kSVM) are ranked by partial R squared (a measure of the variance accounted for by that input). High Risk Social Score indicates that a given participant scored as high risk on a social index comprised of family structure, education and employment of primary caregiver, household income, primary language, and maternal age. Maternal Milk at Discharge indicates that the infant received any maternal milk at time of discharge from the hospital, regardless of amount. GBAS is the Global Brain Abnormality Score published by Kidokoro et al, 2013. Moderate/Severe Chorioamnionitis was determined based on placental pathology. Morphometry Component 15 included the left temporal lobe, left superior temporal gyrus (STG), right fusiform, right posterior cingulate, right temporal lobe, right medial and inferior temporal gyri, bilateral occipital lobes, left fusiform, left insula, and the brainstem. Structural Connectivity Component 5 included the left parietal lobe, bilateral cingulate, right parietal lobe, bilateral medial and inferior temporal gyri, right fusiform, left STG, bilateral frontal lobe white matter, right parahippocampal gyrus, right STG, right insula, and the left fusiform. Morphometry Component 24 included the left fusiform, the left medial and inferior temporal gyri, the brainstem, the bilateral temporal lobes, the bilateral STG, and the hippocampi and amygdala. 