
Neonatal Quality Improvement 5
Session: Neonatal Quality Improvement 5
 Credit")
 photo")
Ying Ge Wang, MD (she/her/hers)
PGY3
NYP-Weill Cornell
New York City, New York, United States
.png) Figure 1. Key driver diagram showing primary aims, drivers and change ideas.
Figure 1. Key driver diagram showing primary aims, drivers and change ideas..png) Figure 2. Adherence to N-PASS scoring in the first 12 post-operative hours improved from 4% to 58%.
Figure 2. Adherence to N-PASS scoring in the first 12 post-operative hours improved from 4% to 58%.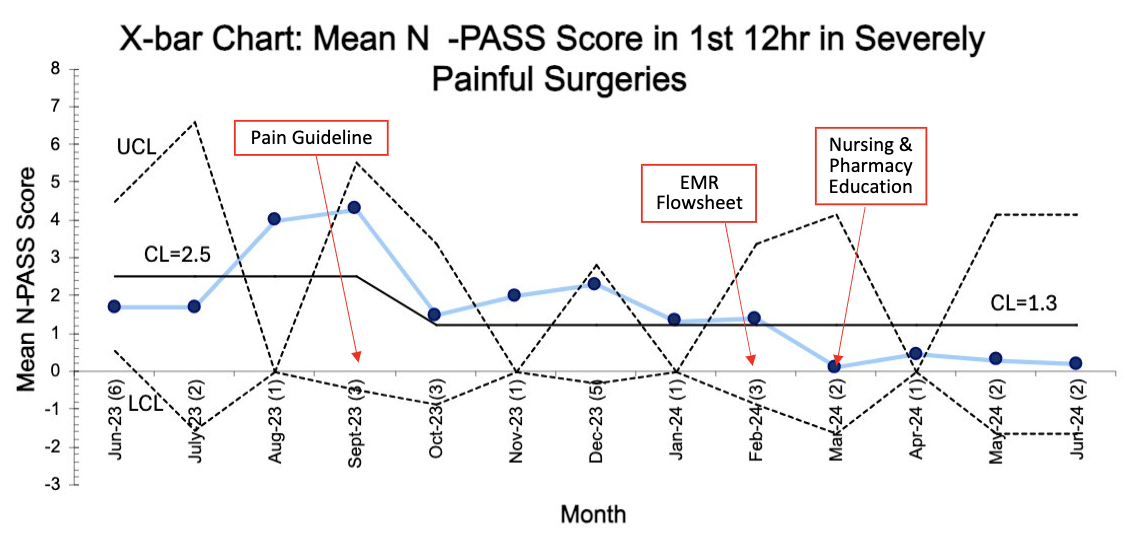 Figure 3. Mean N-PASS scores in the first 12 post-operative hours decreased from 2.5 to 1.3 in surgeries anticipated to cause severe pain.Figure 1. Key driver diagram showing primary aims, drivers and change ideas.Figure 2. Adherence to N-PASS scoring in the first 12 post-operative hours improved from 4% to 58%.Figure 3. Mean N-PASS scores in the first 12 post-operative hours decreased from 2.5 to 1.3 in surgeries anticipated to cause severe pain.