Neonatal Quality Improvement 6
Session: Neonatal Quality Improvement 6
536 - Improving Neonatal care quality through Network Initiatives and Control charts
Saturday, April 26, 2025
2:30pm - 4:45pm HST
Publication Number: 536.5287
Tejasvi Chaudhari, Canberra Hospital, Yarralumla, Australian Capital Territory, Australia; Ian I. Callander, University of New South Wales, Sydney, New South Wales, Australia; Javeed Travadi, Health New Zealand, Waikato Hospital, Hamilton, Waikato, New Zealand; Joanne McIntosh, NICU John Hunter Hospital, New lambton heights, New South Wales, Australia

Tejasvi Chaudhari, MD (he/him/his)
Senior Staff Specialist
Canberra Hospital
Yarralumla, Australian Capital Territory, Australia
Presenting Author(s)
Background: Data for improvement should be analyzed dynamically over time focusing on understanding the variation present in the data. Statistical process control (SPC) tools such as control charts can be powerful tools to analyze data over time and help understand variation. Commencing in 2011, eight neonatal intensive care units (NICUs) in New South Wales (NSW) and Australian Capital Territory (ACT), Australia participated in 3 Quality Improvement Collaboratives (QIC’s) namely Sepsis Prevention in NICUS Group (SPRING), early Management of Extremely PREMature Neonates in the first 72 hours (ePREM72) and Nutrition group. These QICs aimed to review outcomes data from participating NICUs (benchmarking), exchange of QI ideas and resources between NICUs, identify potentially better practices, engagement of local clinical staff, and support local improvement efforts.
Objective: We aim to report key outcome data from the NICUS QICs using SPC charts.
Design/Methods: The QIC membership comprised at least one neonatologist and clinical nurse consultant from each NICU. The group met 4-6 times a year to discuss best practices related to infection control (SPRING), early management of extremely preterm neonates (ePREM72), and neonatal nutrition (Nutrition group). Data and comparative data reports were obtained from the NICUS database. Combined quarterly data for key outcomes such as death, major intraventricular hemorrhage (IVH), admission hypothermia, Central line-associated bloodstream infection (CLABSI), necrotizing enterocolitis (NEC), survival without bronchopulmonary dysplasia (BPD) and retinopathy of prematurity (ROP) needing treatment were plotted on an appropriate control chart using QI Macros SPC and QI software for excel. Mean with upper and lower control limits were established to monitor progress or special cause variations in outcomes.
Results: The development of evidence-based consensus recommendations was possible despite the variation in practice between NICUs. Significant reductions were achieved in admission hypothermia and NEC. Major IVH, deaths, CLABSI rates, and ROP needing treatment remained stable. BPD-free survival rates decreased.
Conclusion(s): The findings suggest that control charts can help understand variation and direct improvement efforts when used in conjunction with neonatal network quality improvement initiatives.
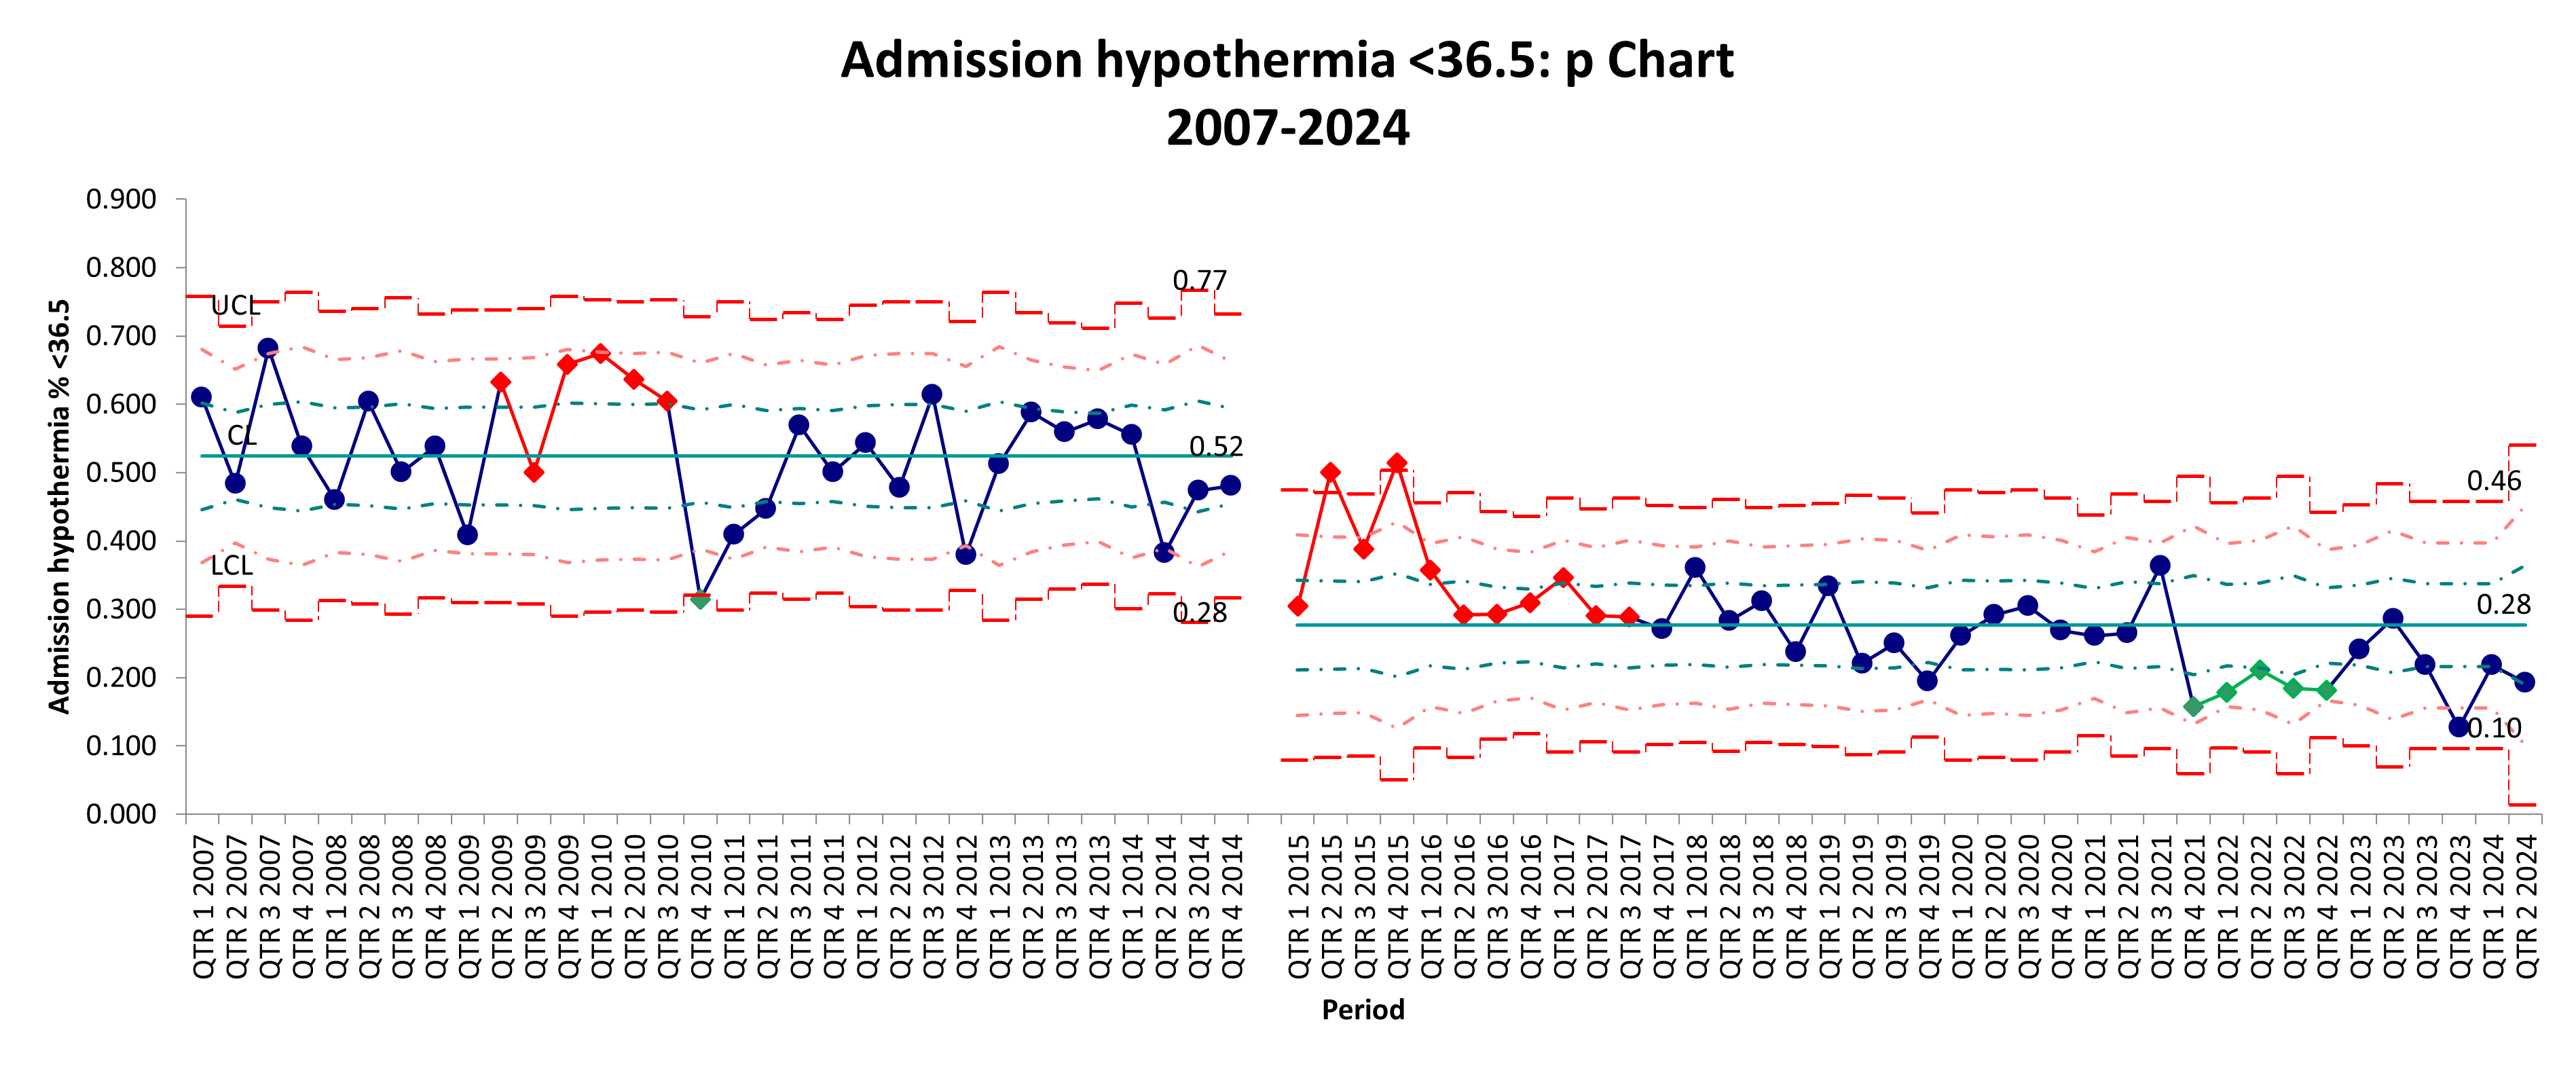
Admission hypothermia ( <36.5): p chart
 p-chart showing the percentage of admission hypothermia (body temperature below 36.5°C) in NICUS ePREM babies from 2007 to 2024. Pre-ePREM data shows higher variability with several points approaching the upper control limit, indicating more frequent instances of admission hypothermia. Post-ePREM data generally shows lower percentages of hypothermia, suggesting an improvement.
 ePREM deaths: p chart
.png) This p-chart tracks the percentage of ePREM deaths over time, with data points plotted quarterly from 2007 to 2024. The centerline (average death rate) seems to have decreased slightly from 13 to 11% in the post-ePrem period, reflecting reduced mortality
This p-chart tracks the percentage of ePREM deaths over time, with data points plotted quarterly from 2007 to 2024. The centerline (average death rate) seems to have decreased slightly from 13 to 11% in the post-ePrem period, reflecting reduced mortalityNecrotizing enterocolitis (NEC) Stage 2 and above: p- chart
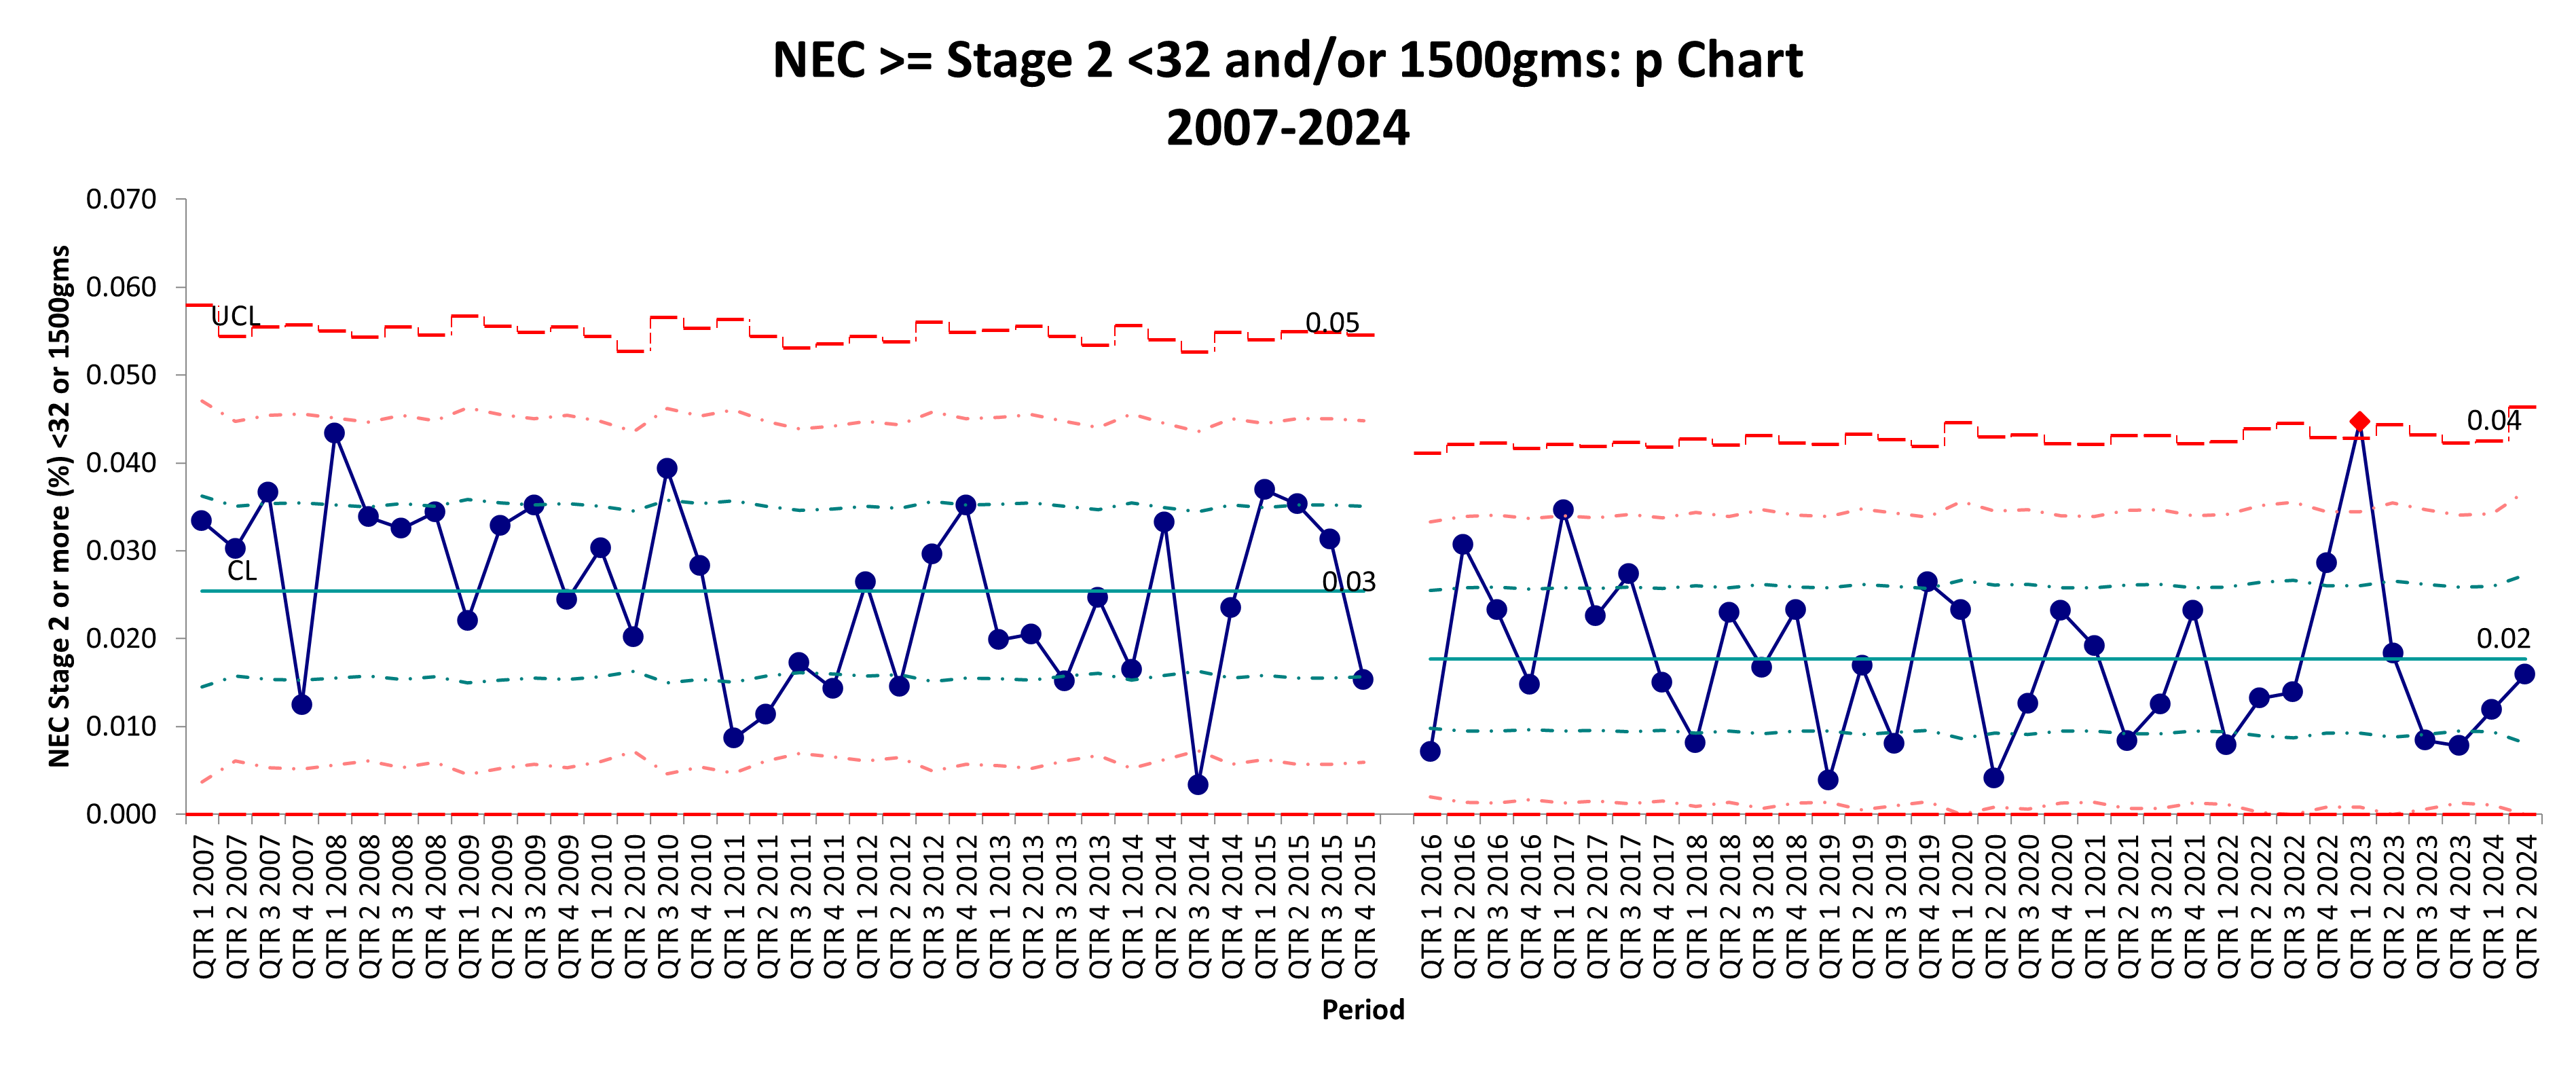
 The control chart tracks the percentage of NEC stage 2 or above cases in VLBW babies <= 32 weeks and/or 1500 grams over time, with data points plotted quarterly from 2007 to 2024. The chart is divided into two distinct periods: before and after the implementation of the Nutrition CPI intervention. There is a noticeable shift in the data points with a reduction of mean from 3 to 2%, which may indicate the impact of the Nutrition CPI intervention
