
Neonatal Quality Improvement 6
Session: Neonatal Quality Improvement 6
 photo")
Tejasvi Chaudhari, MD (he/him/his)
Senior Staff Specialist
Canberra Hospital
Yarralumla, Australian Capital Territory, Australia
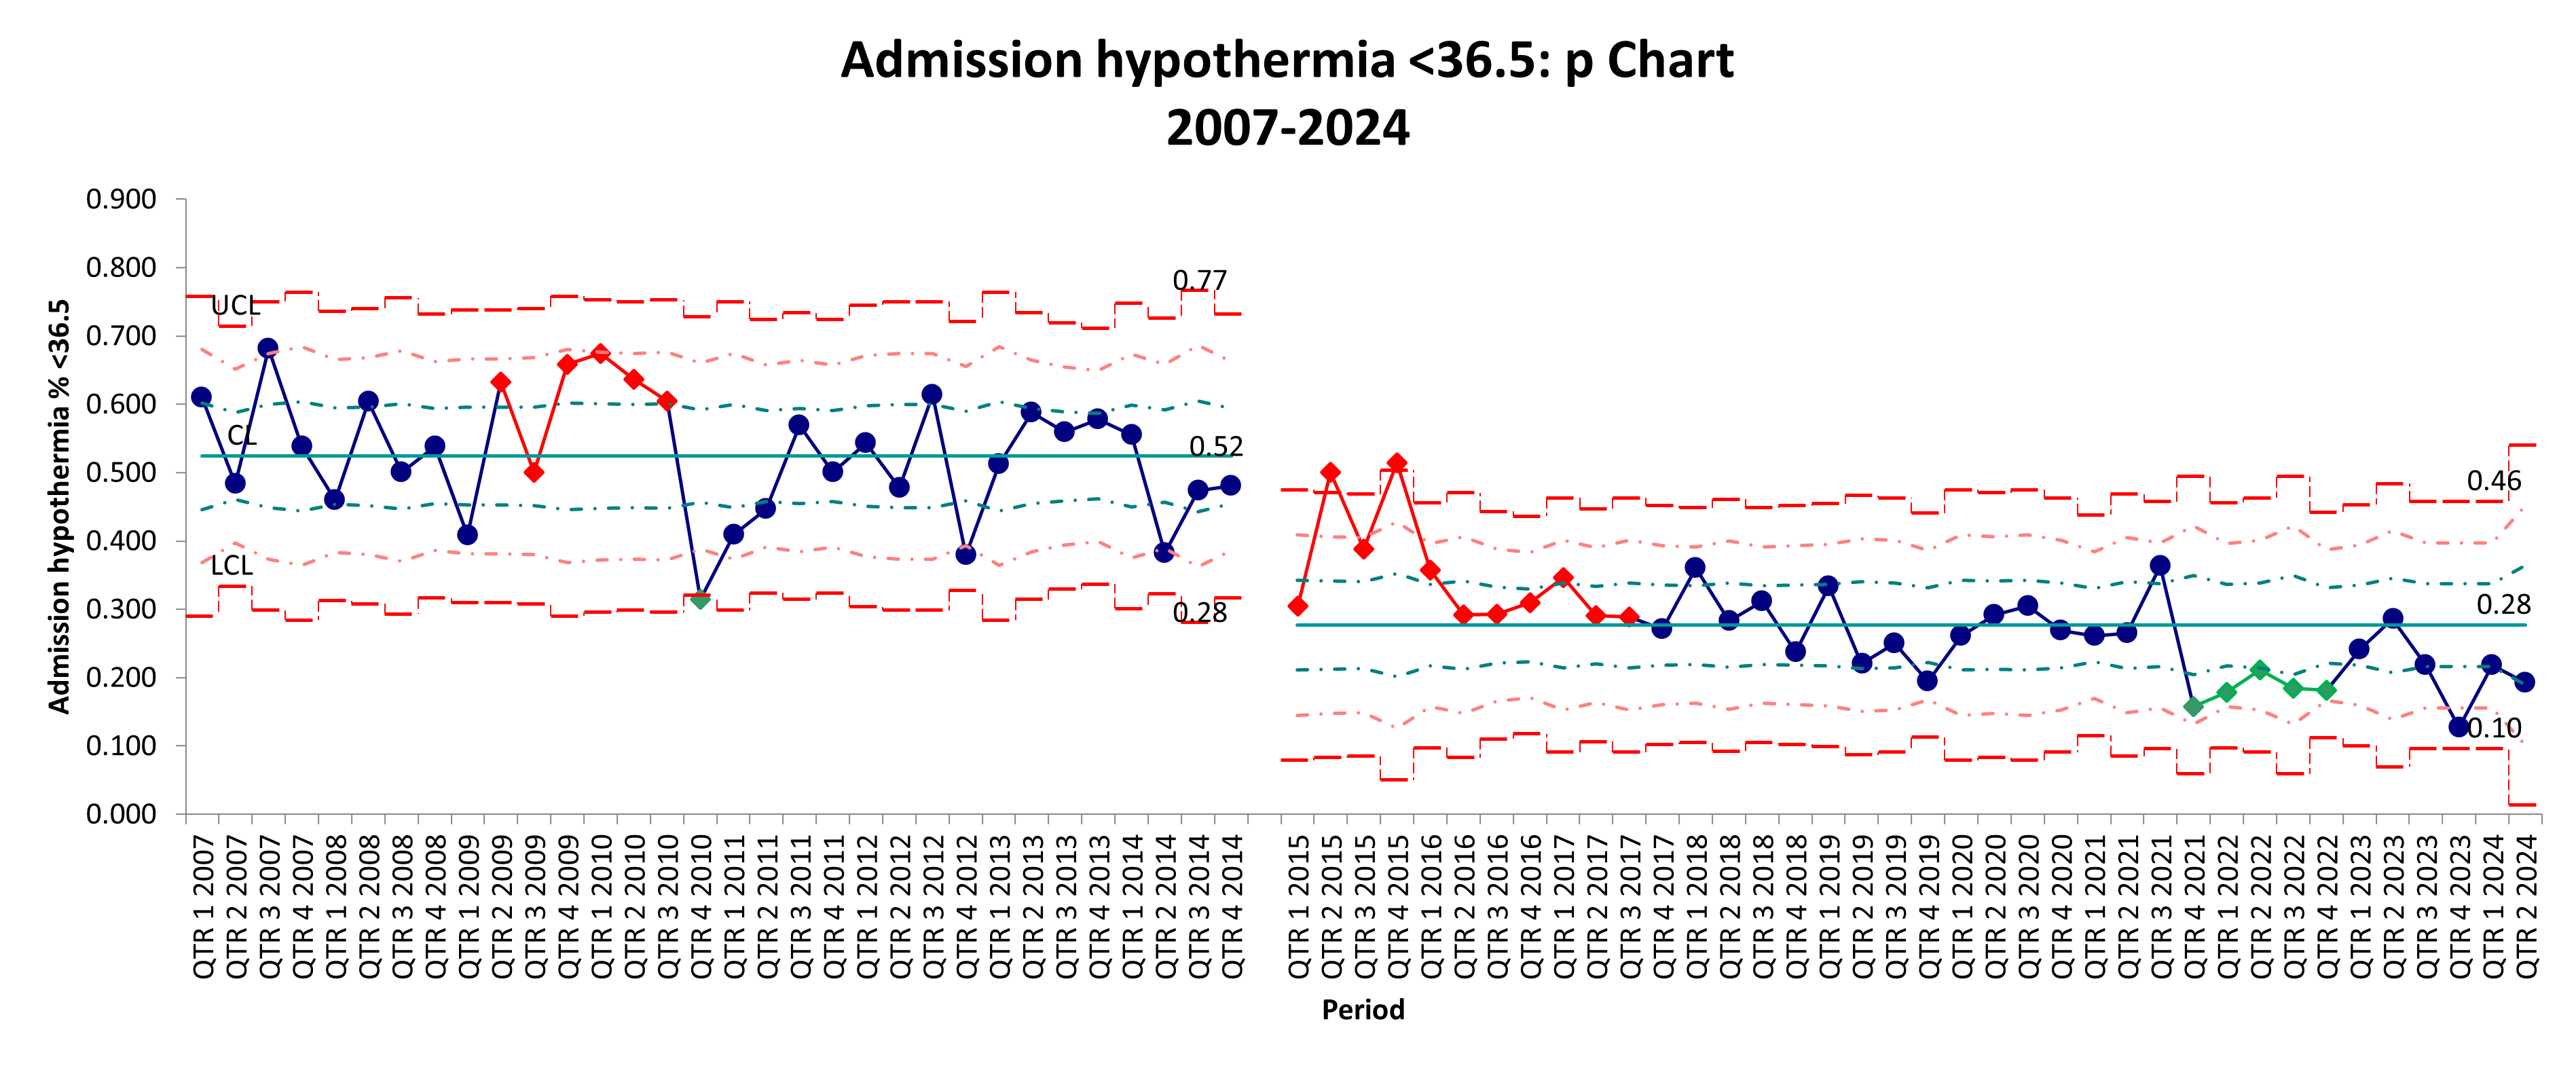 p-chart showing the percentage of admission hypothermia (body temperature below 36.5°C) in NICUS ePREM babies from 2007 to 2024. Pre-ePREM data shows higher variability with several points approaching the upper control limit, indicating more frequent instances of admission hypothermia. Post-ePREM data generally shows lower percentages of hypothermia, suggesting an improvement.
 .png) This p-chart tracks the percentage of ePREM deaths over time, with data points plotted quarterly from 2007 to 2024. The centerline (average death rate) seems to have decreased slightly from 13 to 11% in the post-ePrem period, reflecting reduced mortality
This p-chart tracks the percentage of ePREM deaths over time, with data points plotted quarterly from 2007 to 2024. The centerline (average death rate) seems to have decreased slightly from 13 to 11% in the post-ePrem period, reflecting reduced mortality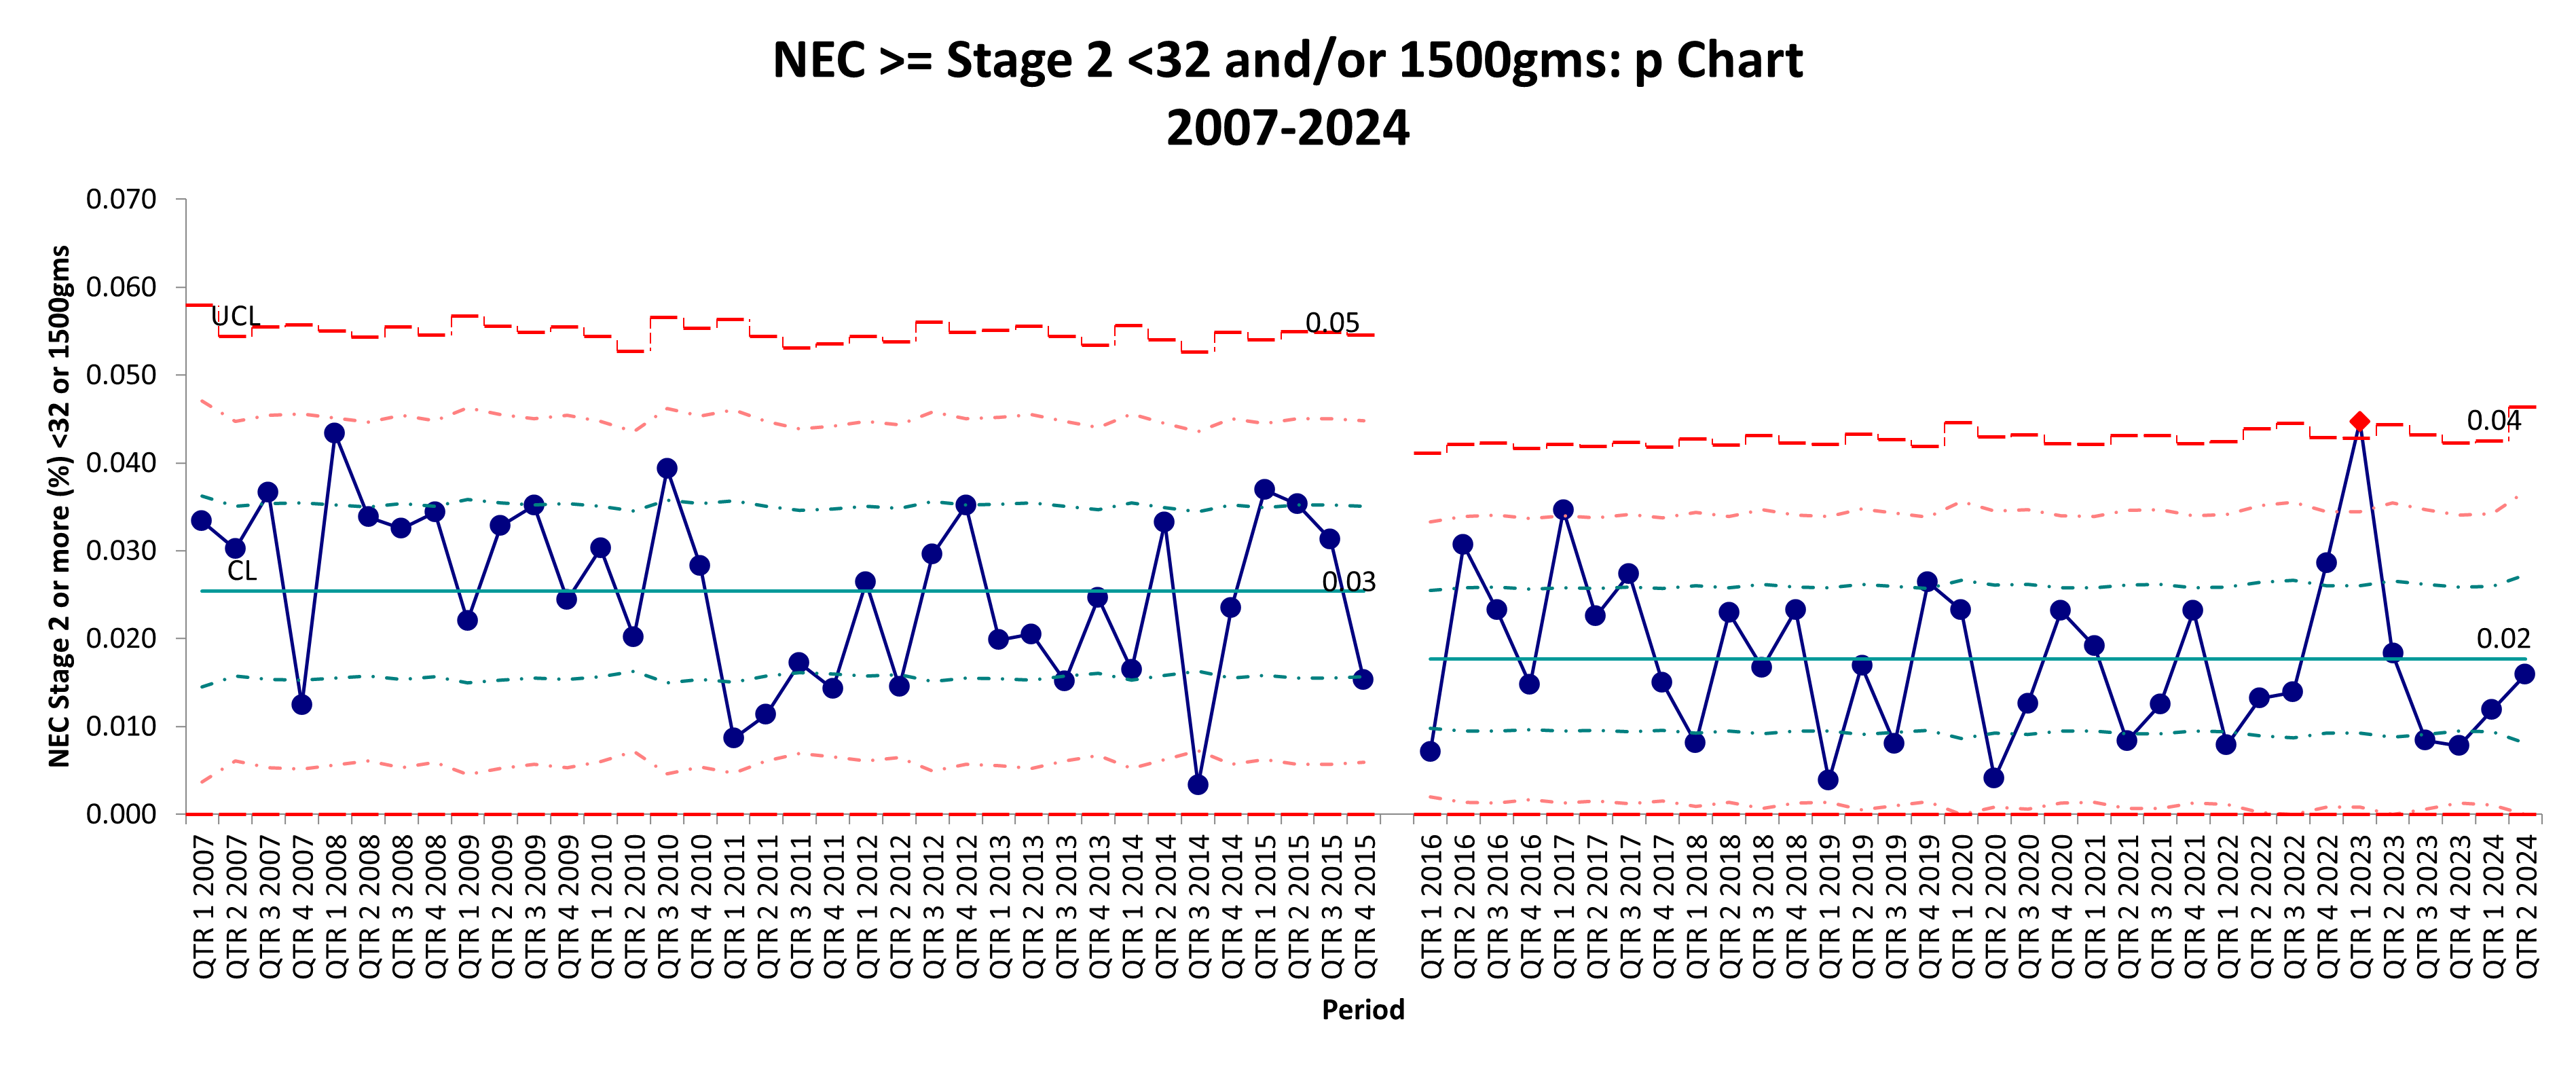 The control chart tracks the percentage of NEC stage 2 or above cases in VLBW babies <= 32 weeks and/or 1500 grams over time, with data points plotted quarterly from 2007 to 2024. The chart is divided into two distinct periods: before and after the implementation of the Nutrition CPI intervention. There is a noticeable shift in the data points with a reduction of mean from 3 to 2%, which may indicate the impact of the Nutrition CPI intervention