
Medical Education 7: DEI
Session: Medical Education 7: DEI
 photo")
Maya Maxym, MD, PhD, FAAP (she/her/hers)
Assistant Professor
University of Hawai'i John A. Burns School of Medicine
HONOLULU, Hawaii, United States
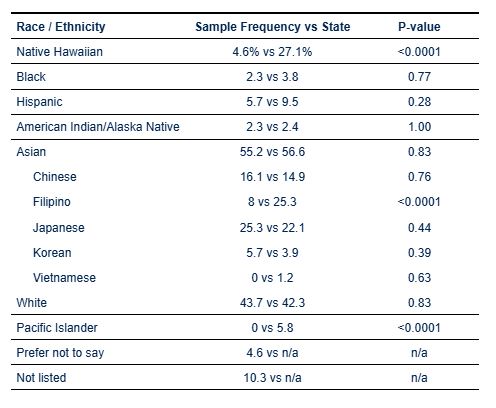 Native Hawaiian, Filipino, and Other Pacific Islander physicians are dramatically under-represented in our faculty and residents as compared to State of Hawai'i demographics. Source: State-level data was taken from the State of Hawaii Department of Business, Economic Development, and Tourism 2021 Detailed Race Characteristics Report (https://dbedt.hawaii.gov/economic/detailed-race-characteristics_acs2021/). One exception was state-level data for Hispanic or Latino/a/x ethnicity, which was taken from the 2020 US Census (https://www.census.gov/library/stories/state-by-state/hawaii-population-change-between-census-decade.html).
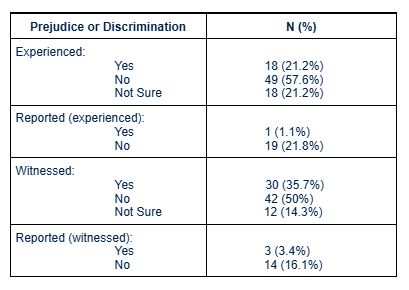 A significant minority of all respondents had experienced or witnessed one or more types of prejudice or discrimination, but reporting rates were exceedingly low for both categories.
.jpg) Most common types of discrimination or prejudice experienced by respondents included race/ethnicity and gender. While all categories were represented in witnessed types of prejudice or discrimination, notable differences between experienced and witnessed included statistically significantly higher percentages of prejudice or discrimination based on gender identity / expression, socioeconomic status, educational background, and non-native English speaker / country of origin.
Most common types of discrimination or prejudice experienced by respondents included race/ethnicity and gender. While all categories were represented in witnessed types of prejudice or discrimination, notable differences between experienced and witnessed included statistically significantly higher percentages of prejudice or discrimination based on gender identity / expression, socioeconomic status, educational background, and non-native English speaker / country of origin. 