
Health Equity/Social Determinants of Health 2
Session: Health Equity/Social Determinants of Health 2

Matthew M. Tran, MD
Fellow Physician
UPMC Childrens Hospital of Pittsburgh
Pittsburgh, Pennsylvania, United States
.png) Data are reported as n (%), mean sd, or median (1st, 3rd quartiles). ADI score ranges from 0-100, with higher scores indicating more neighborhood socioeconomic disadvantage. Walk-Score ranges from 0-100, with higher scores indicating more walkable environments. ADI = Area Deprivation Index, CHD = congenital heart disease.
Data are reported as n (%), mean sd, or median (1st, 3rd quartiles). ADI score ranges from 0-100, with higher scores indicating more neighborhood socioeconomic disadvantage. Walk-Score ranges from 0-100, with higher scores indicating more walkable environments. ADI = Area Deprivation Index, CHD = congenital heart disease. 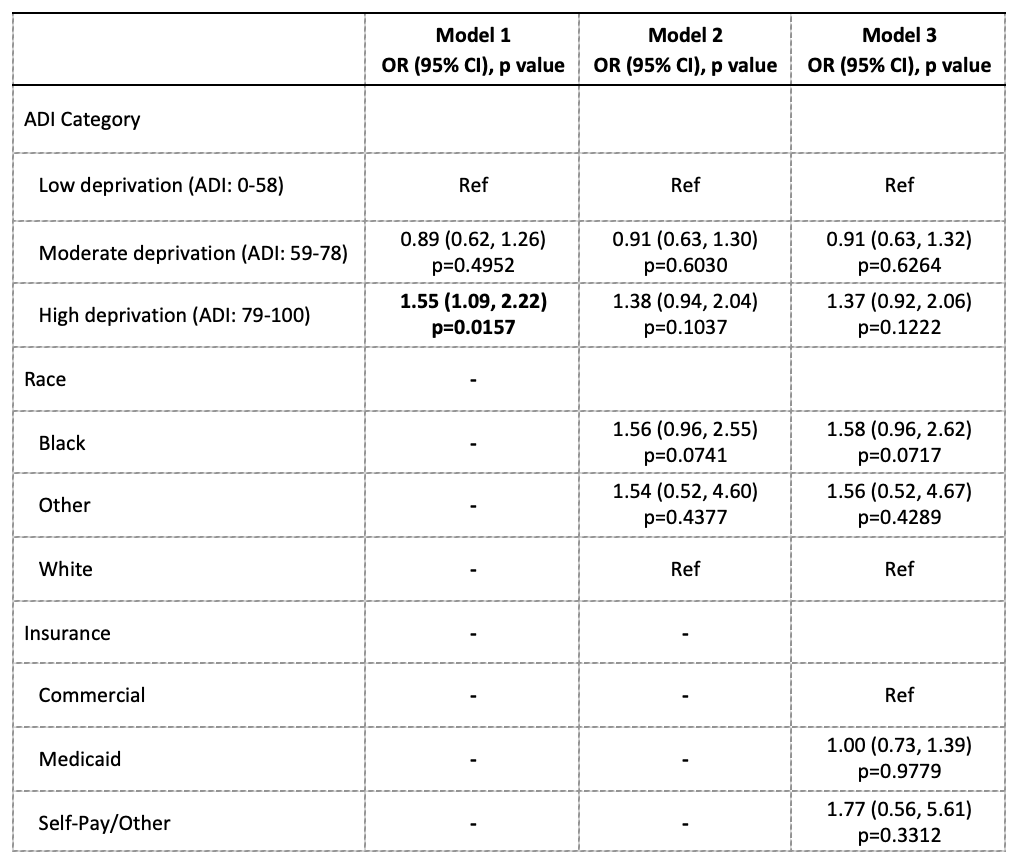 Effects estimated from multi-level logistic regression models, with a random intercept term included to account for patients nested within zip codes. Model 1 is unadjusted for covariates. Model 2 is adjusted for race. Model 3 is adjusted for Model 2 + insurance type. Bolded estimates indicate statistical significance at the 0.05 alpha level. ADI, Area Deprivation Index score ranges from 0-100, with higher scores indicating more neighborhood socioeconomic disadvantage; OR, odds ratio; CI, confidence interval; CHD, congenital heart disease.
 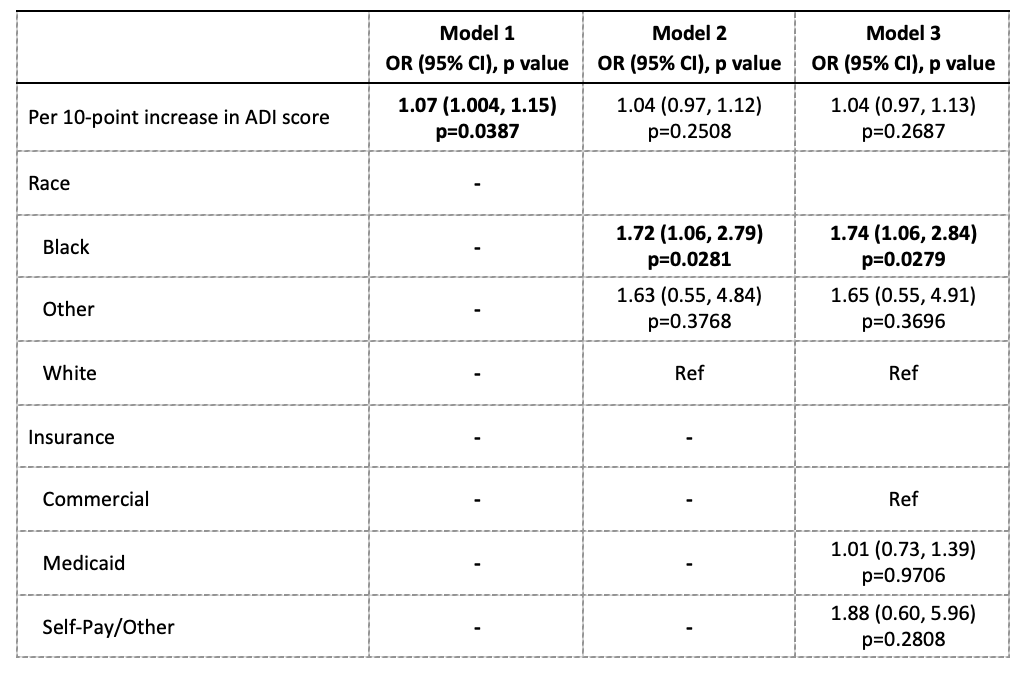 Effects estimated from multi-level logistic regression models, with a random intercept term included to account for patients nested within zip codes. Model 1 is unadjusted for covariates. Model 2 is adjusted for race. Model 3 is adjusted for Model 2 + insurance type. Bolded estimates indicate statistical significance at the 0.05 alpha level. ADI, Area Deprivation Index score ranges from 0-100, with higher scores indicating more neighborhood socioeconomic disadvantage; OR, odds ratio; CI, confidence interval; CHD, congenital heart disease.