
Quality Improvement/Patient Safety 6
Session: Quality Improvement/Patient Safety 6
 Credit")
 photo")
John M. Harris, MD (he/him/his)
Executive Director Surgical Services
CHOC Children's Hospital of Orange County
Orange, California, United States
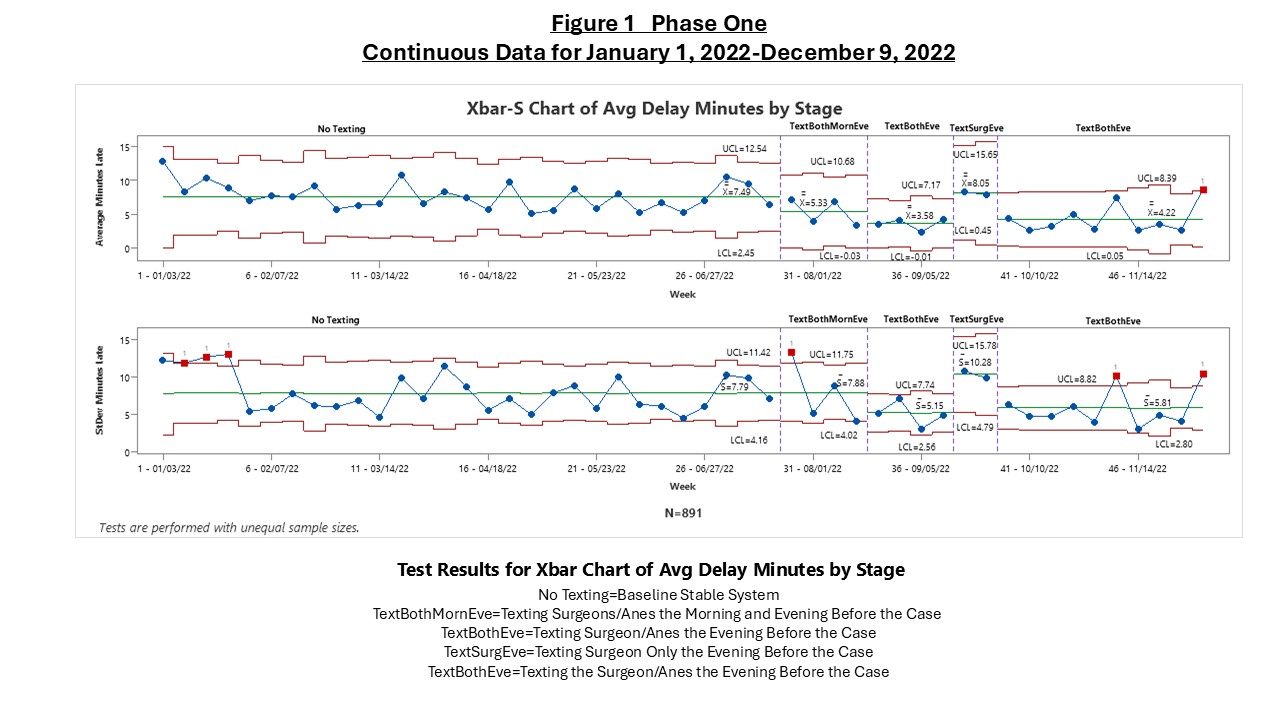 This is an Xbar-S chart that shows the results of the different stages reflecting different interventions.
 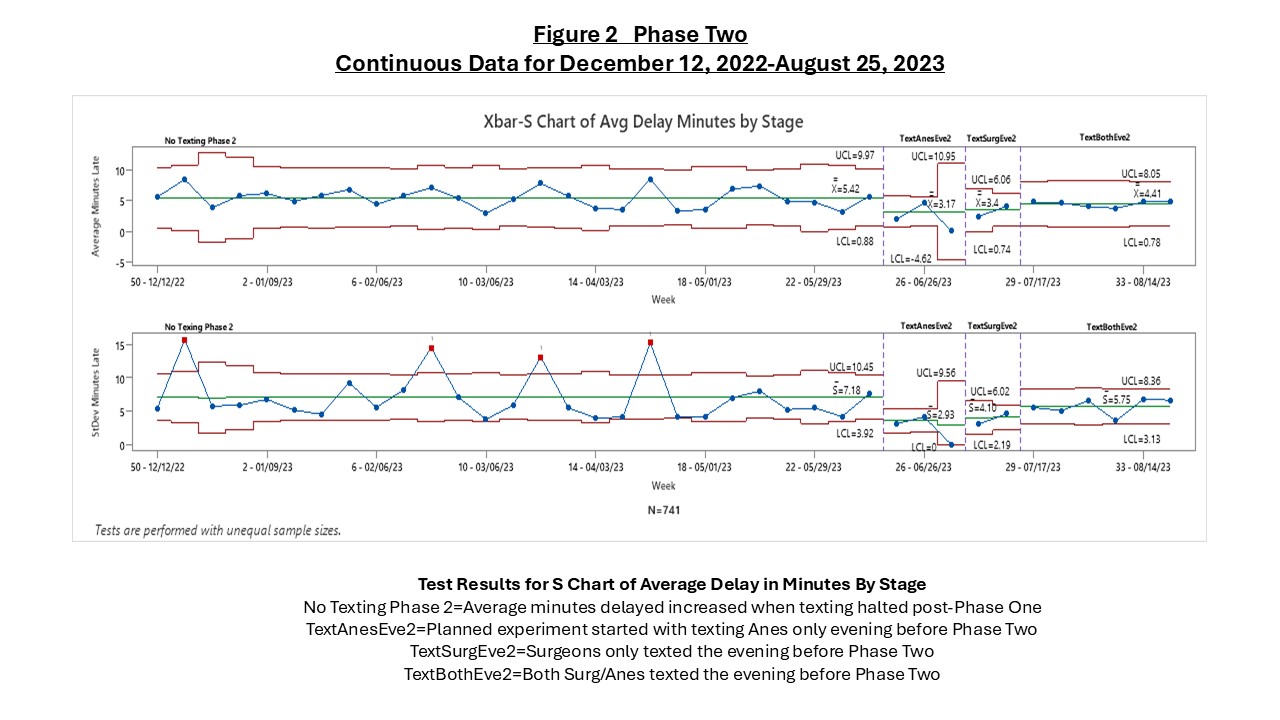 This is an Xbar-S chart that shows the results of the different stages reflecting different interventions.
 .jpg) The Dot Diagram shows the effects of the different texting strategies on the first case start times. "A" reflects when only the Anesthesiologist was texted, "S" when only the Surgeon was texted, and "AS" reflects when both the Anesthesiologist and Surgeon were texted. The response plots to the right shows the relationship for each of the three combinations of two factors, where "ATR" represents Anesthesia Text Reminder and "STR" represents Surgeon Text Reminder.
The Dot Diagram shows the effects of the different texting strategies on the first case start times. "A" reflects when only the Anesthesiologist was texted, "S" when only the Surgeon was texted, and "AS" reflects when both the Anesthesiologist and Surgeon were texted. The response plots to the right shows the relationship for each of the three combinations of two factors, where "ATR" represents Anesthesia Text Reminder and "STR" represents Surgeon Text Reminder.