
Neonatal Quality Improvement 4
Session: Neonatal Quality Improvement 4
 Credit")
 photo")
Gisel Rivera, MD (she/her/hers)
Fellow
Weill Cornell
New York, New York, United States
.jpg) Figure 1. Multiple sequential interventions were performed through 8 PDSA cycles
Figure 1. Multiple sequential interventions were performed through 8 PDSA cycles 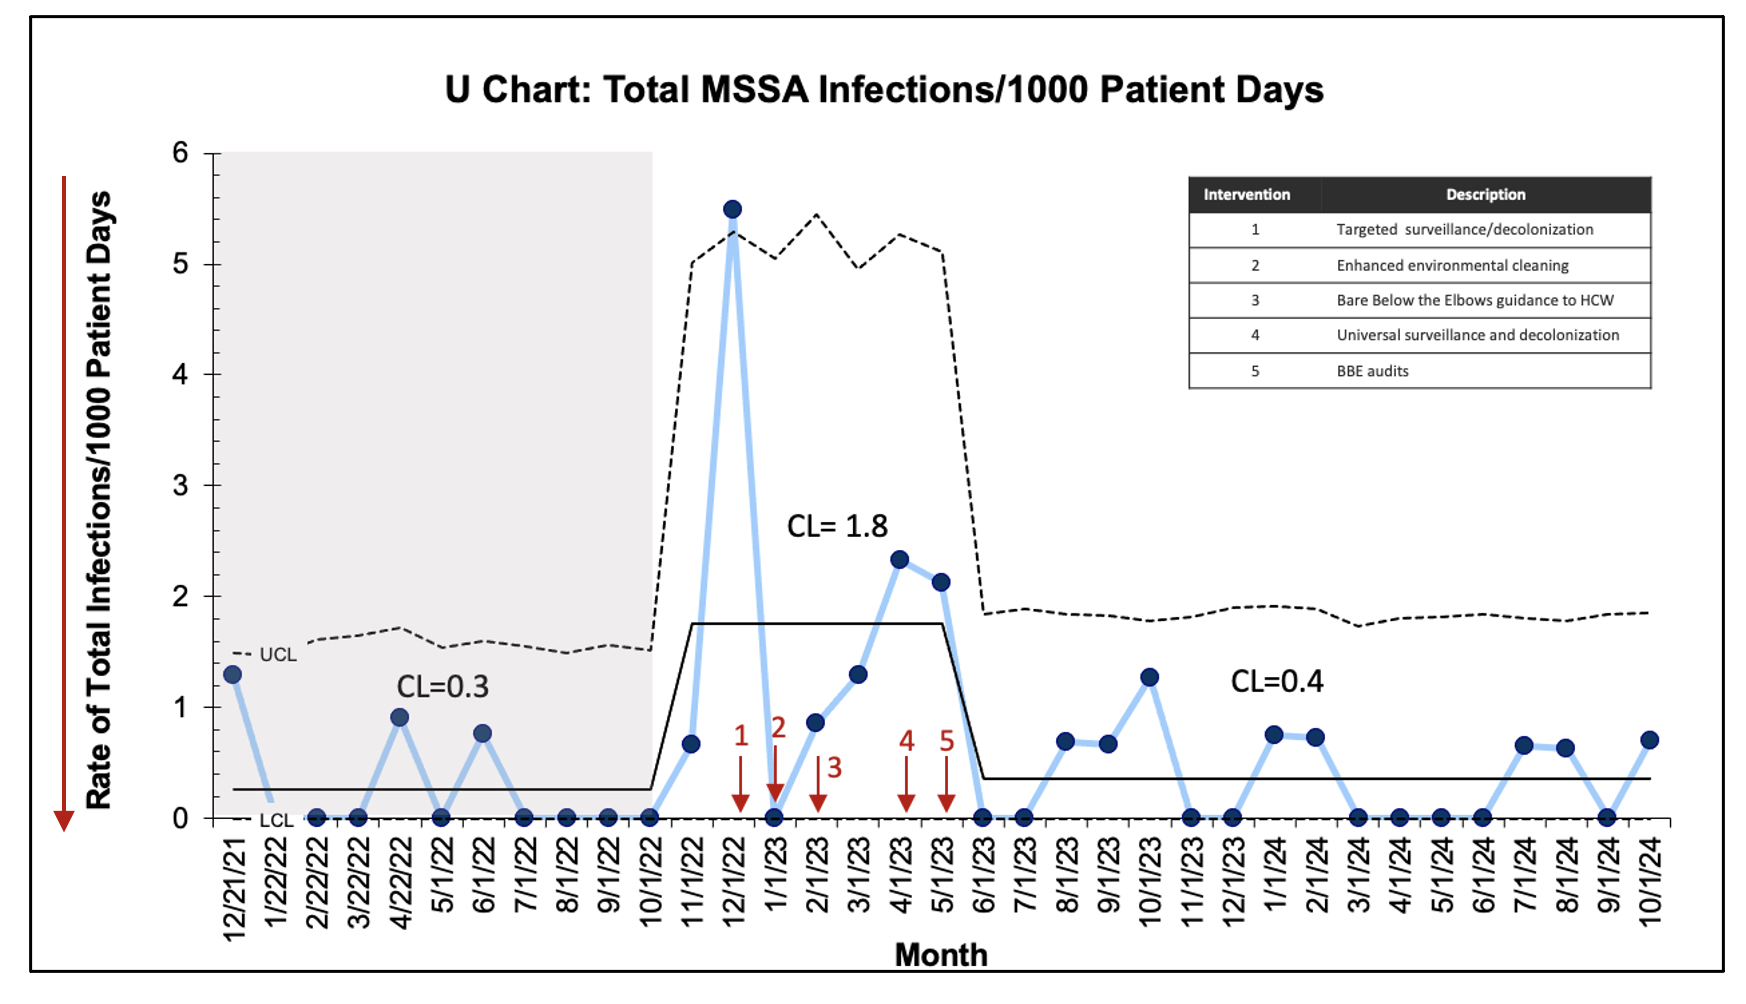 Figure 2. U-chart displaying monthly total MSSA infections per 1000 PD. Arrows indicate interventions. Dashed lines indicate LCL and UCL.
 .jpg) Figure 3. A, P-chart displaying percentage of monthly MSSA colonization in the unit. B, P-chart displaying monthly mupirocin decolonization compliance. C, P-chart displaying monthly compliance with bare below the elbows practice by audits. D, P-Chart displaying monthly central line bundle compliance. Dashed lines indicate LCL and UCL.
Figure 3. A, P-chart displaying percentage of monthly MSSA colonization in the unit. B, P-chart displaying monthly mupirocin decolonization compliance. C, P-chart displaying monthly compliance with bare below the elbows practice by audits. D, P-Chart displaying monthly central line bundle compliance. Dashed lines indicate LCL and UCL. 