
Health Equity/Social Determinants of Health 2
Session: Health Equity/Social Determinants of Health 2
Jane Hwang, MD
Fellow
Oregon Health & Science University - - Portland, OR
Portland, Oregon, United States
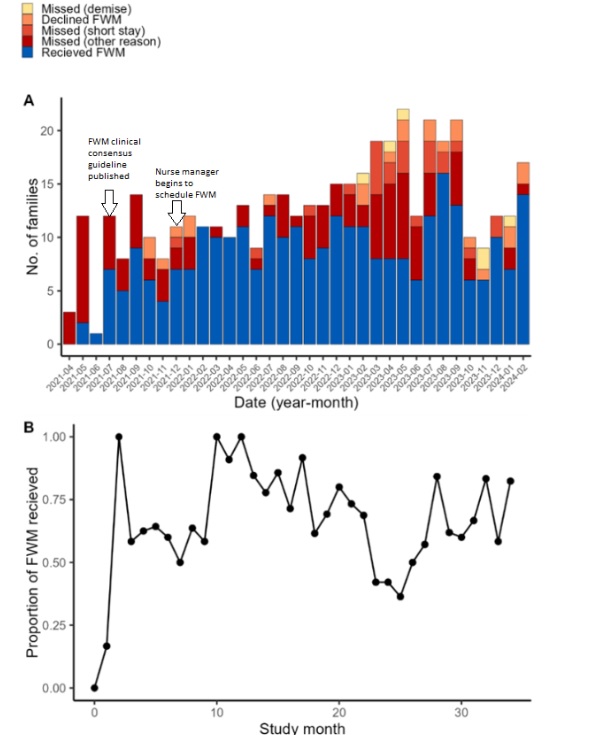 A) The number of families that received a FWM any time (blue) compared to those that did not by study month, due to the demise of the infant (yellow), the family declining the FWM (orange), too short a stay in the NICU (light red), or other reason (dark red). B) The proportion of families that received a FWM at any time out of all those that met the criteria. X-axis displays the number of months starting with first month of the study (2021-04).
 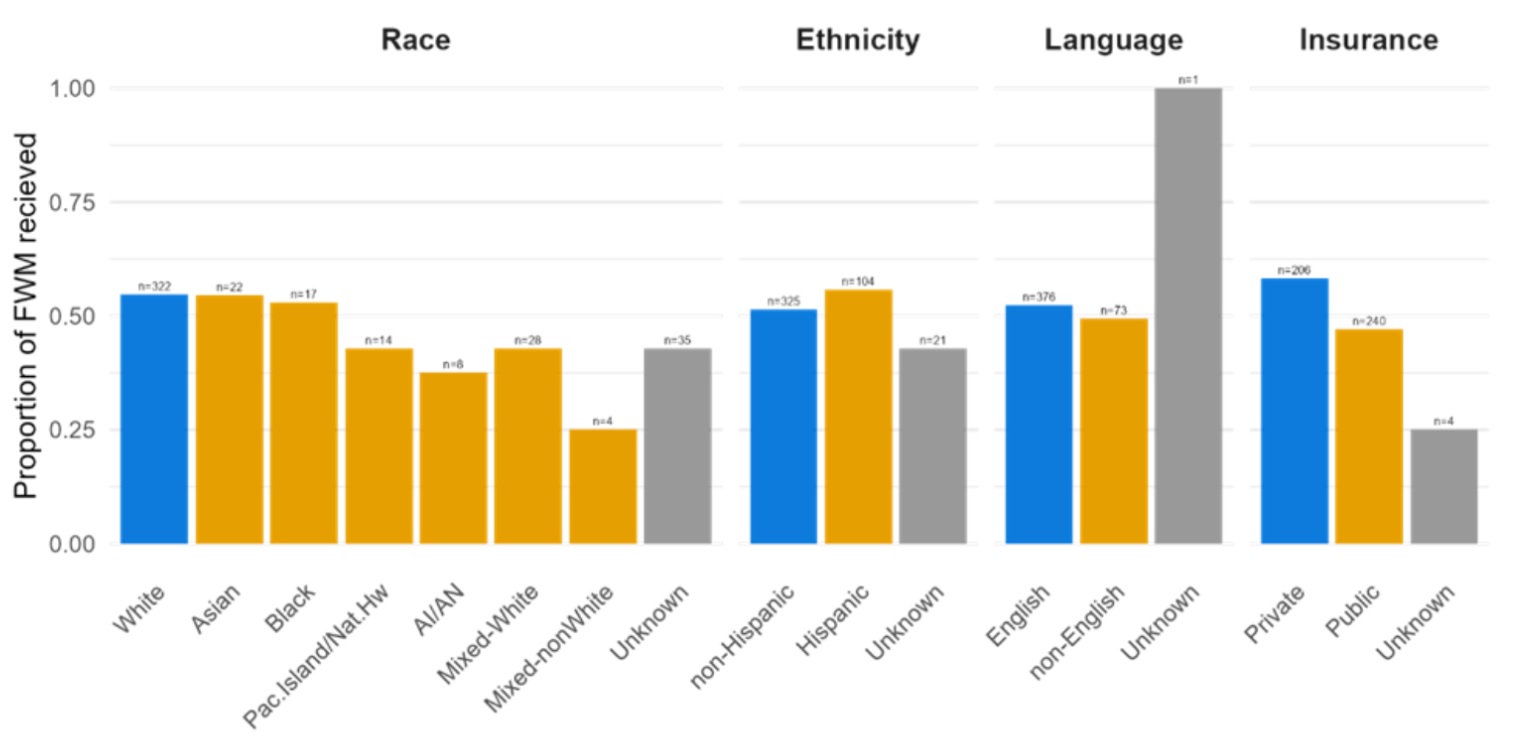 The proportion of qualifying families that received a FWM within seven days of admission over the course of the study separated by race, ethnicity, language and insurance type. SDH categories that may place patients at risk to receive disparate care are displayed in orange, SDH categories at lower risk for disparate care are in blue, and unknown categorization are represented by grey bars. Shown above each bar is the number of families represented by each bar.
 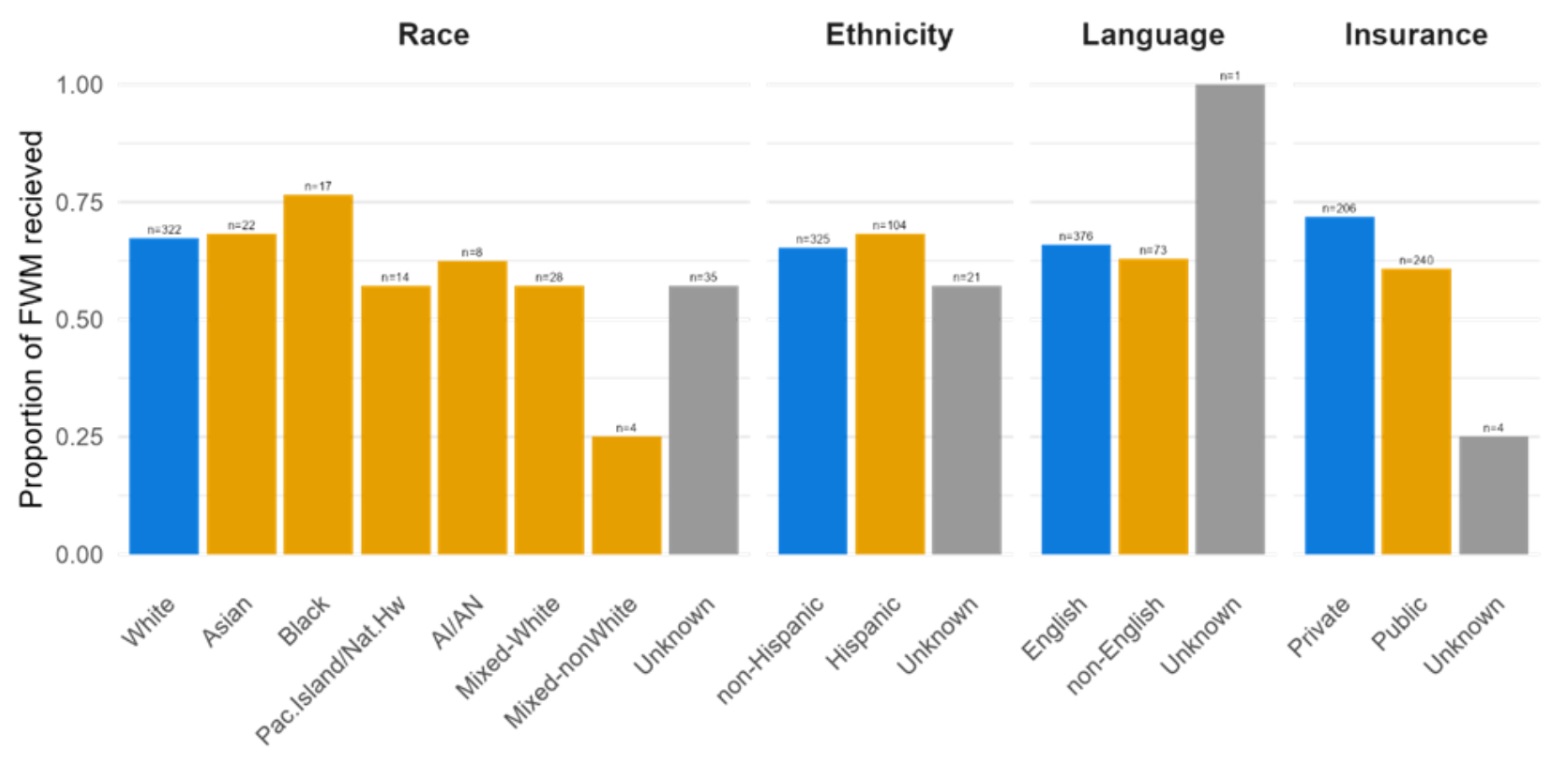 The proportion of qualifying families that received a FWM at any time separated by SDH categories.A) The number of families that received a FWM any time (blue) compared to those that did not by study month, due to the demise of the infant (yellow), the family declining the FWM (orange), too short a stay in the NICU (light red), or other reason (dark red). B) The proportion of families that received a FWM at any time out of all those that met the criteria. X-axis displays the number of months starting with first month of the study (2021-04). The proportion of qualifying families that received a FWM within seven days of admission over the course of the study separated by race, ethnicity, language and insurance type. SDH categories that may place patients at risk to receive disparate care are displayed in orange, SDH categories at lower risk for disparate care are in blue, and unknown categorization are represented by grey bars. Shown above each bar is the number of families represented by each bar. The proportion of qualifying families that received a FWM at any time separated by SDH categories.