
Hospital Medicine 2: Quality Improvement
Session: Hospital Medicine 2: Quality Improvement
 Credit")
Kara L. Oliver, DO (she/her/hers)
Pediatric Hospitalist
Jacobs School of Medicine and Biomedical Sciences at the University at Buffalo
AMHERST, New York, United States
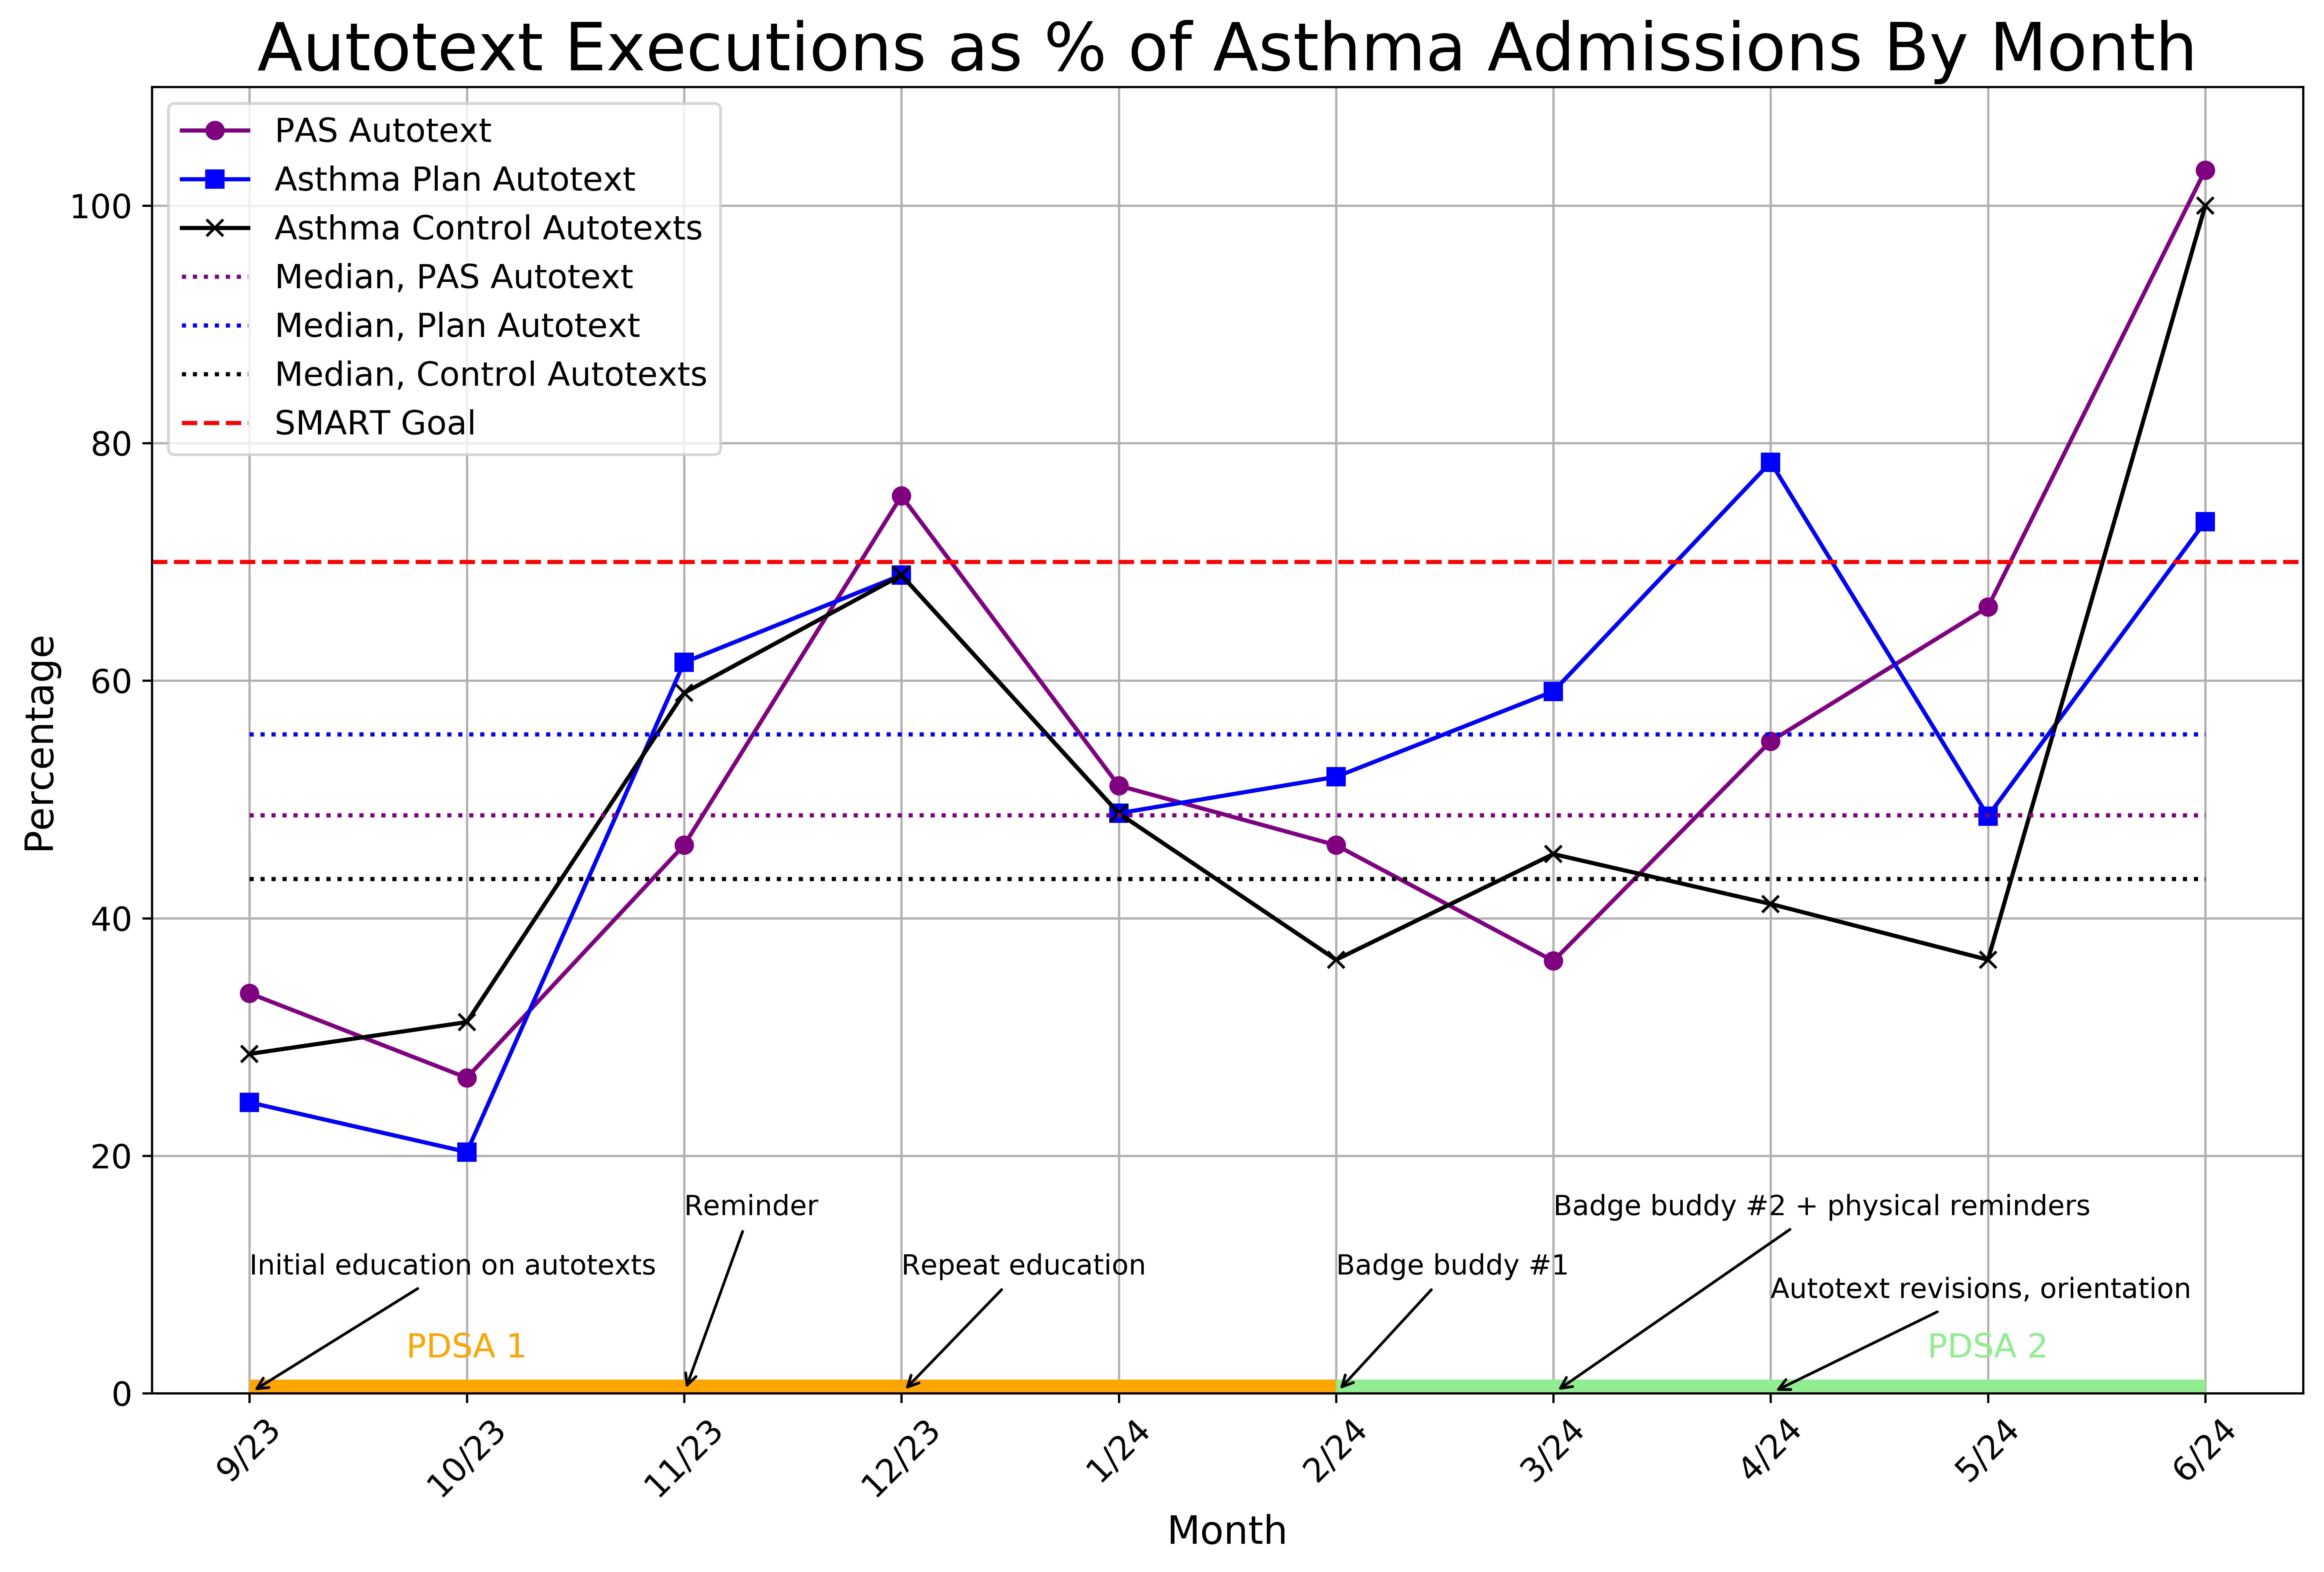 Fig. 1: Run chart of the executions of each autotext category - PAS, plan and control - as a percentage of total asthma admissions. Select interventions are labeled. Note that the evaluation periods of PDSA 1 and PDSA 2 comprise the last three months of the respective period after implementing appropriate interventions. The median as well as monthly values are depicted for each category of autotext, along with the goal of 70% executions, reached for all autotexts at the end of PDSA 2.
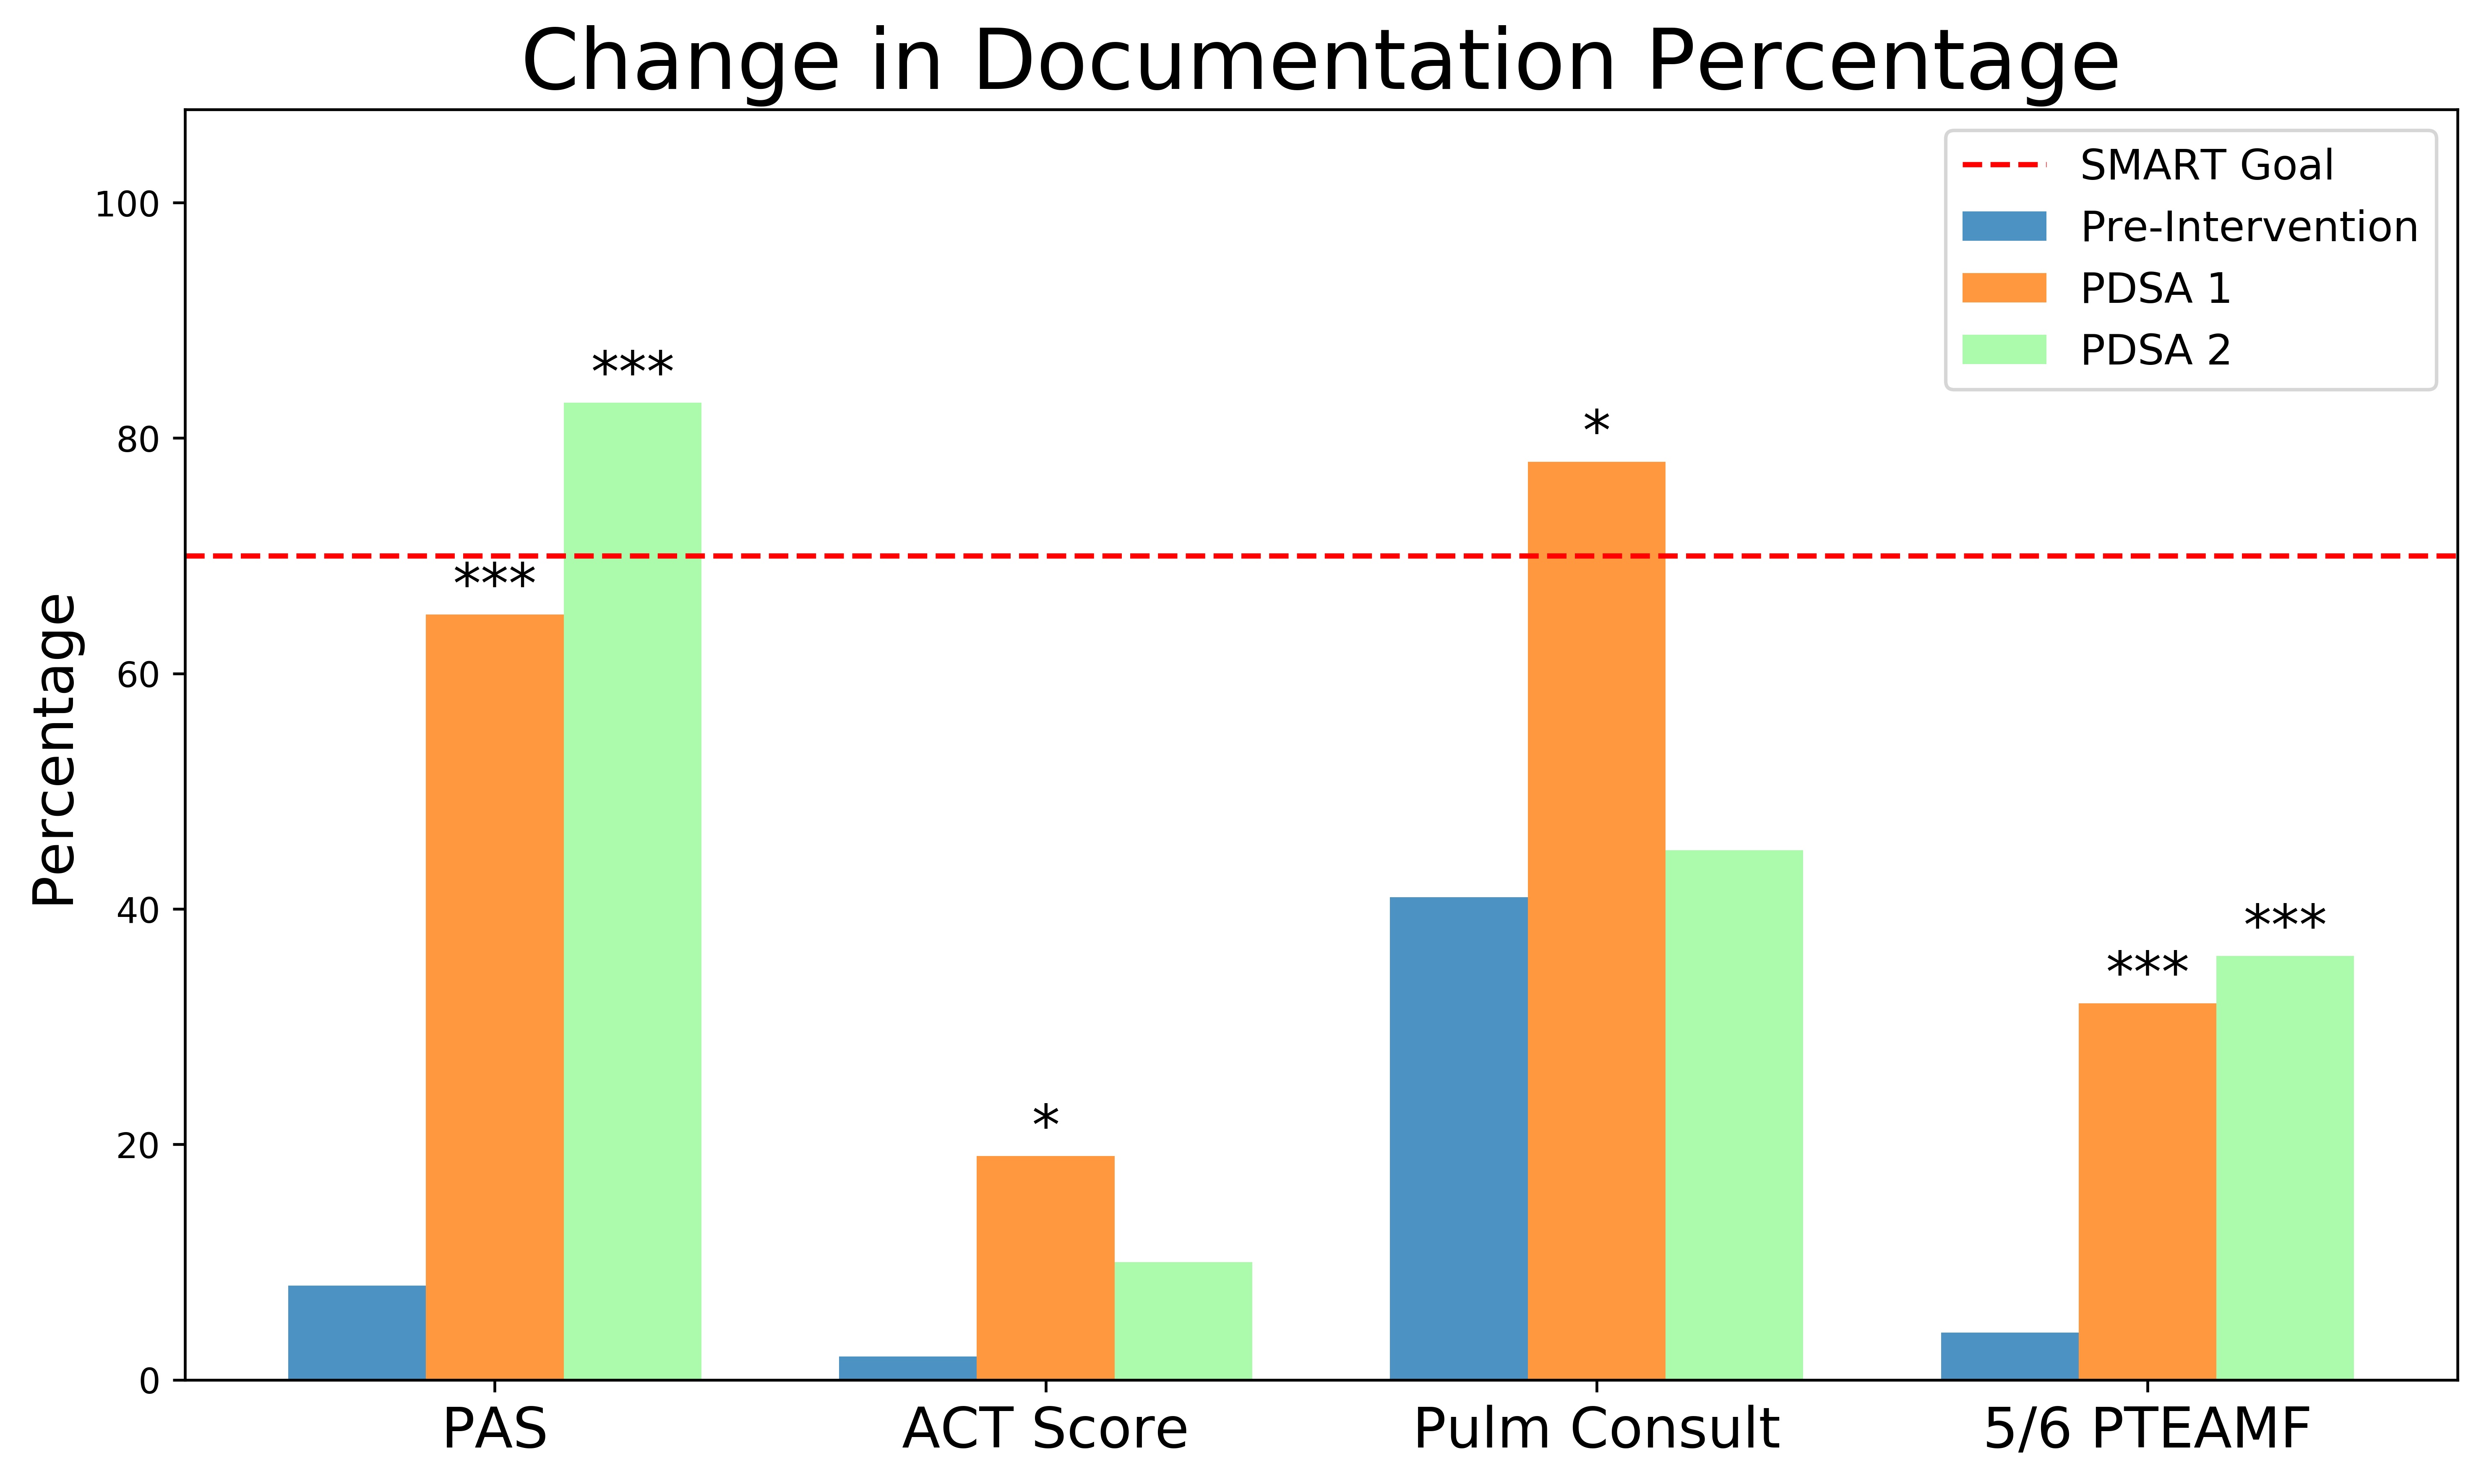 Fig. 2: Change in documentation of key items during the pre-intervention period and the set evaluation periods for
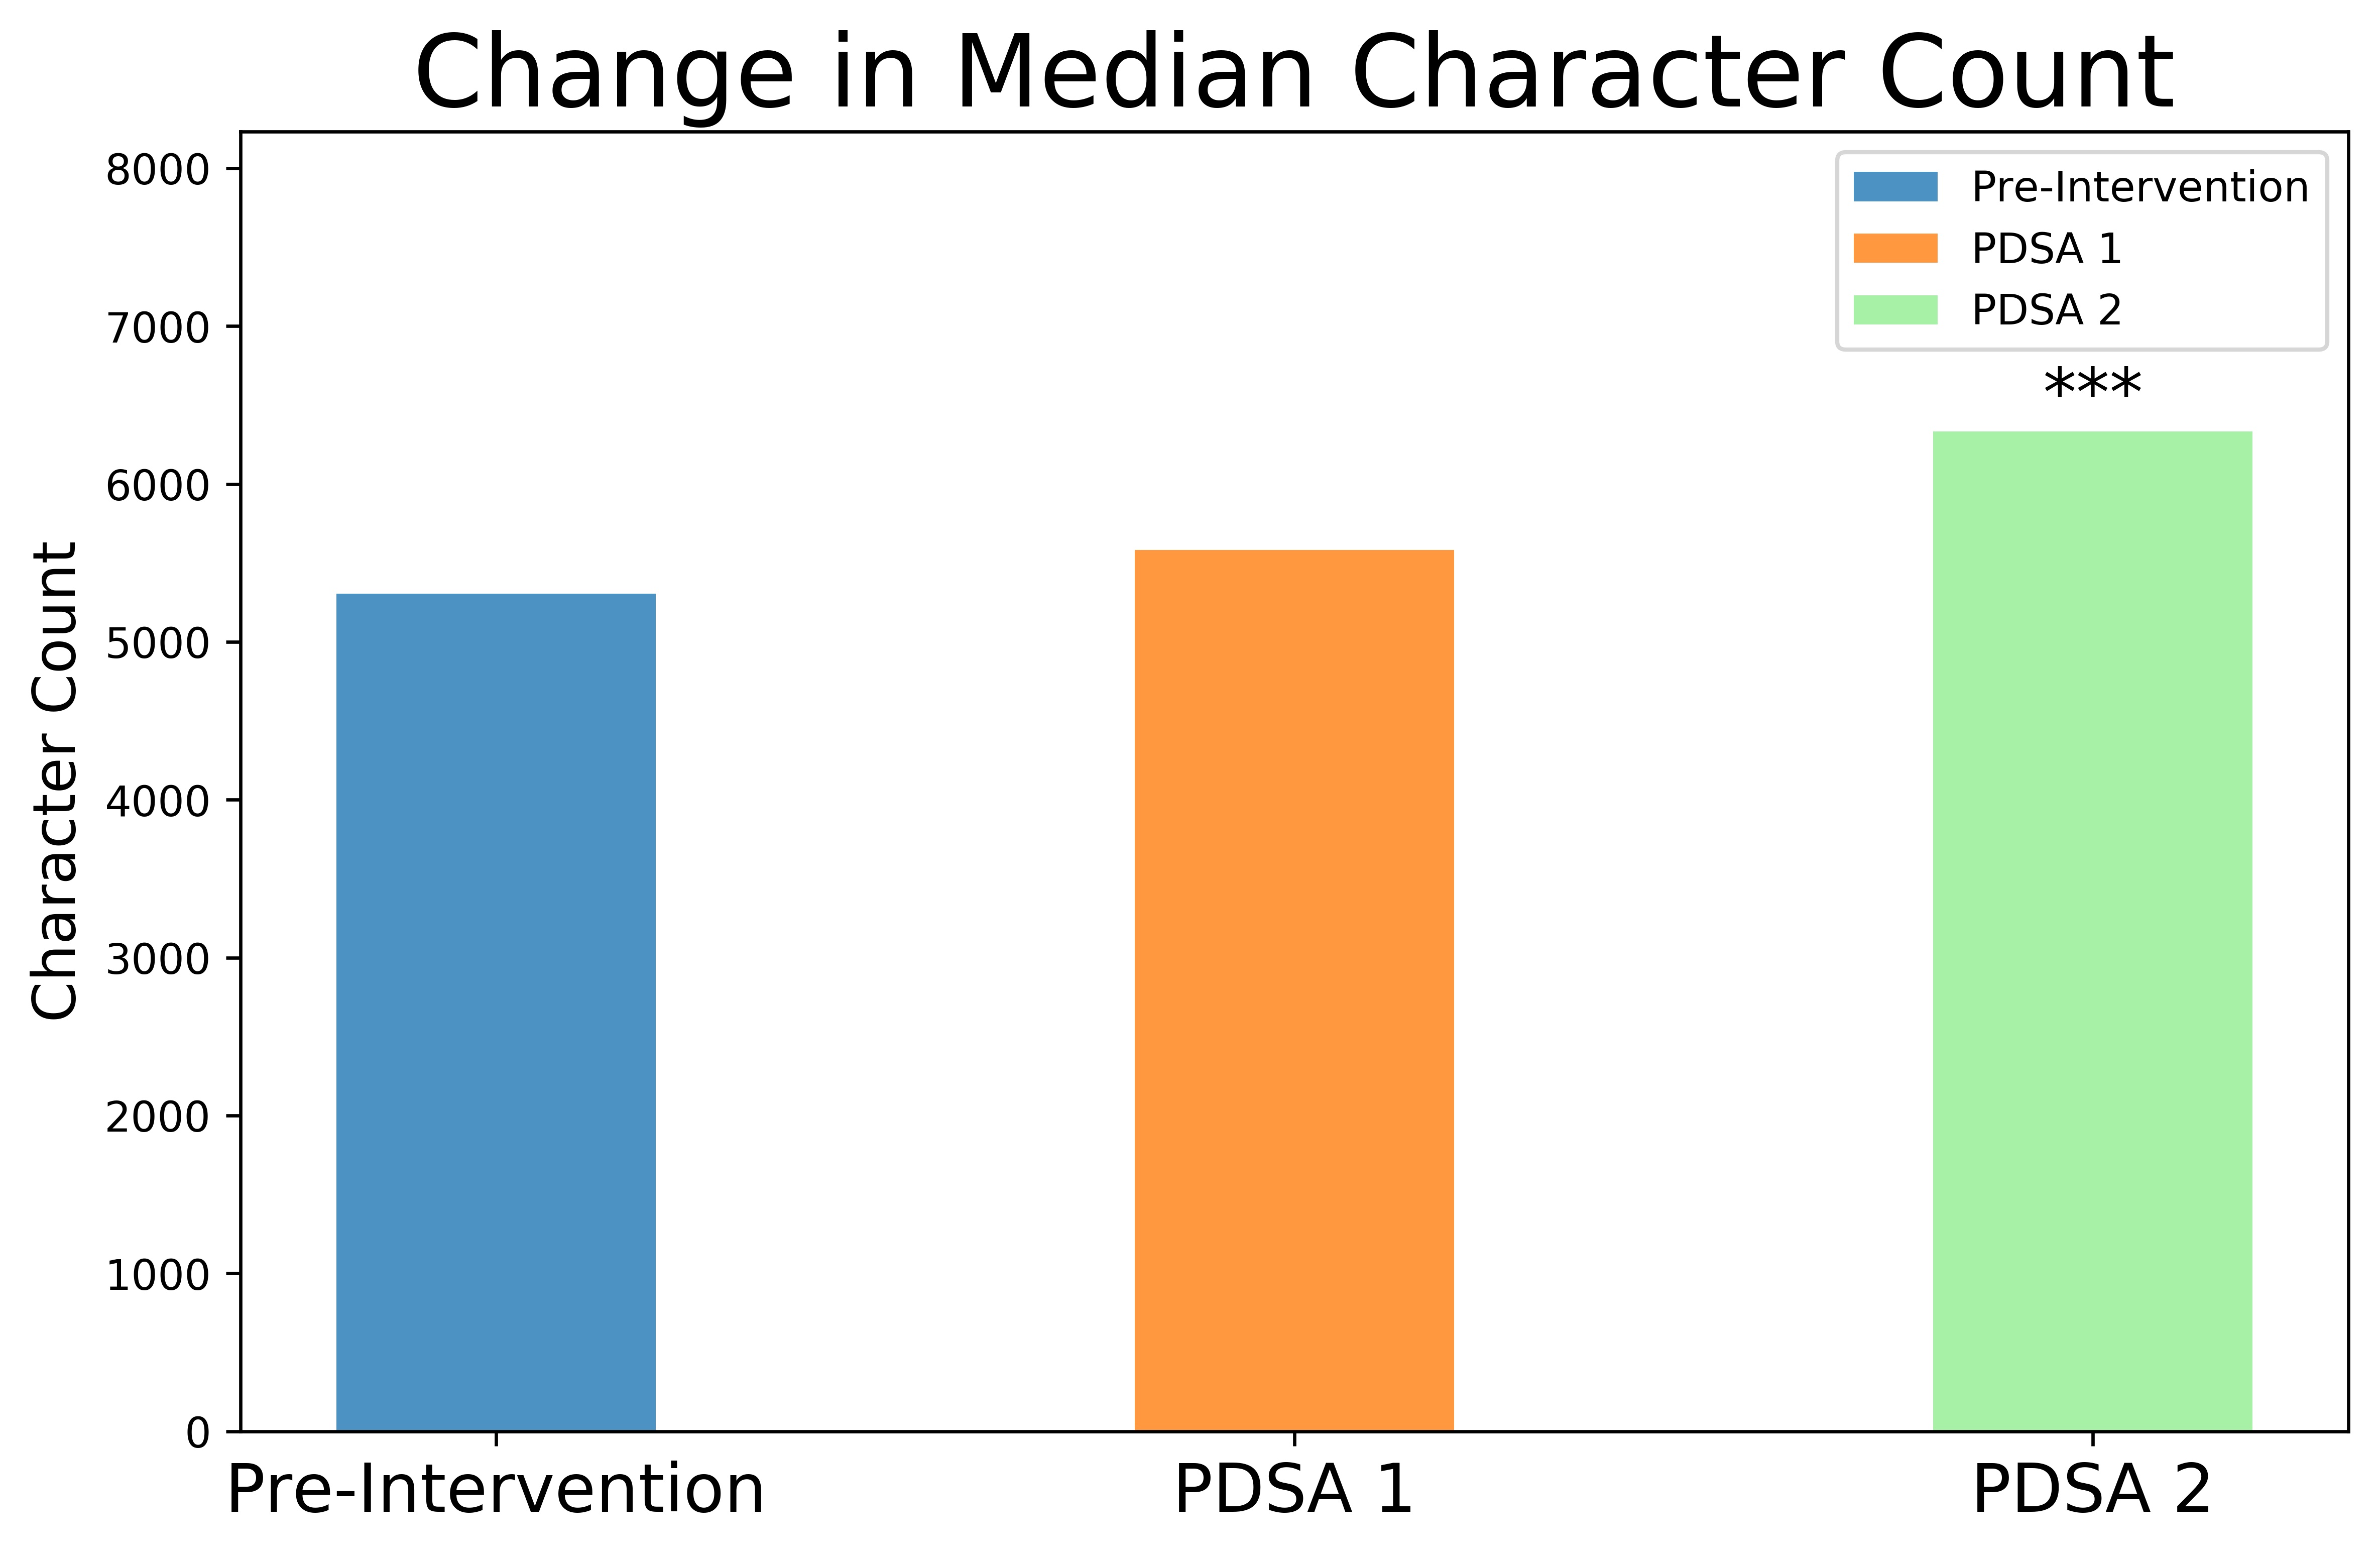 Fig. 3: Median character count in the pre-intervention period, PDSA#1, and PDSA #2.