Neonatal Neurology 7: Pre-Clinical 1
Session: Neonatal Neurology 7: Pre-Clinical 1
 photo")
Sin Yin Lim, PharmD (he/him/his)
Assistant Professor
University of Wisconsin School of Pharmacy
Madison, Wisconsin, United States
.jpg)
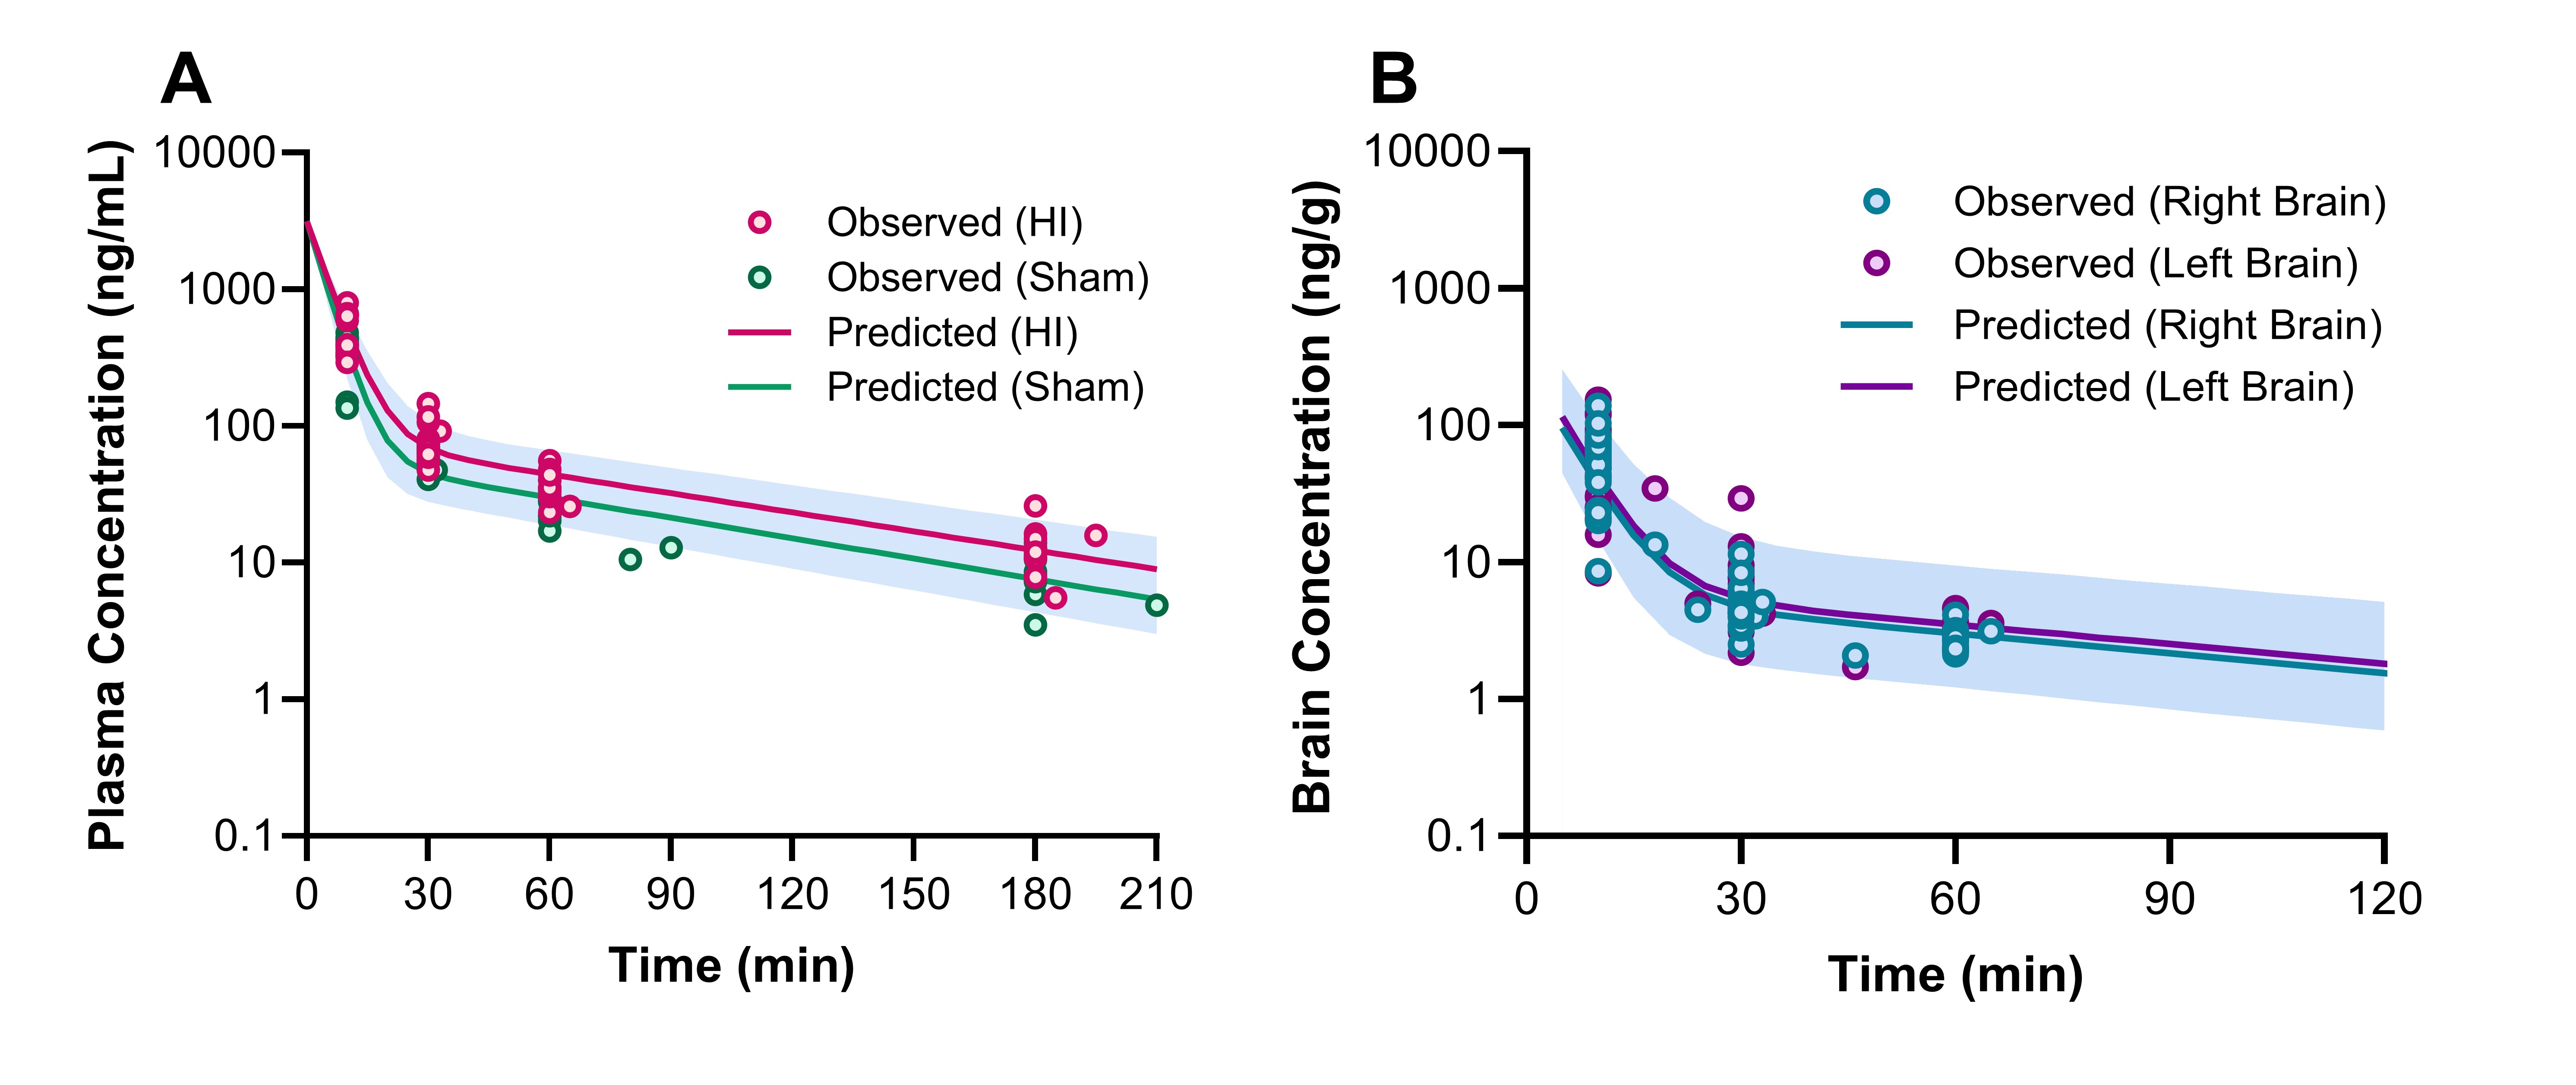 Plasma (A) and brain (B) pharmacokinetic profiles of 7,8-DHF. In graph A, the circles represent the observed concentrations for neonatal mice with hypoxia-ischemia (HI) related brain injury (red) and without brain injury (sham; green). The solid lines represent the predicted concentration-time profiles for HI (red) and sham mice (green). In graph B, the circles represent the observed right (teal) and left (purple) brain concentrations. The solid lines represent the predicted concentration-time profiles for right (teal) and left (purple) brain hemispheres.