
Public Health & Prevention 3
Session: Public Health & Prevention 3
 photo")
Matthew Z. Dawson, MD (he/him/his)
Pediatric Hospitalists
Dayton Children's Hospital
Oakwood, Ohio, United States
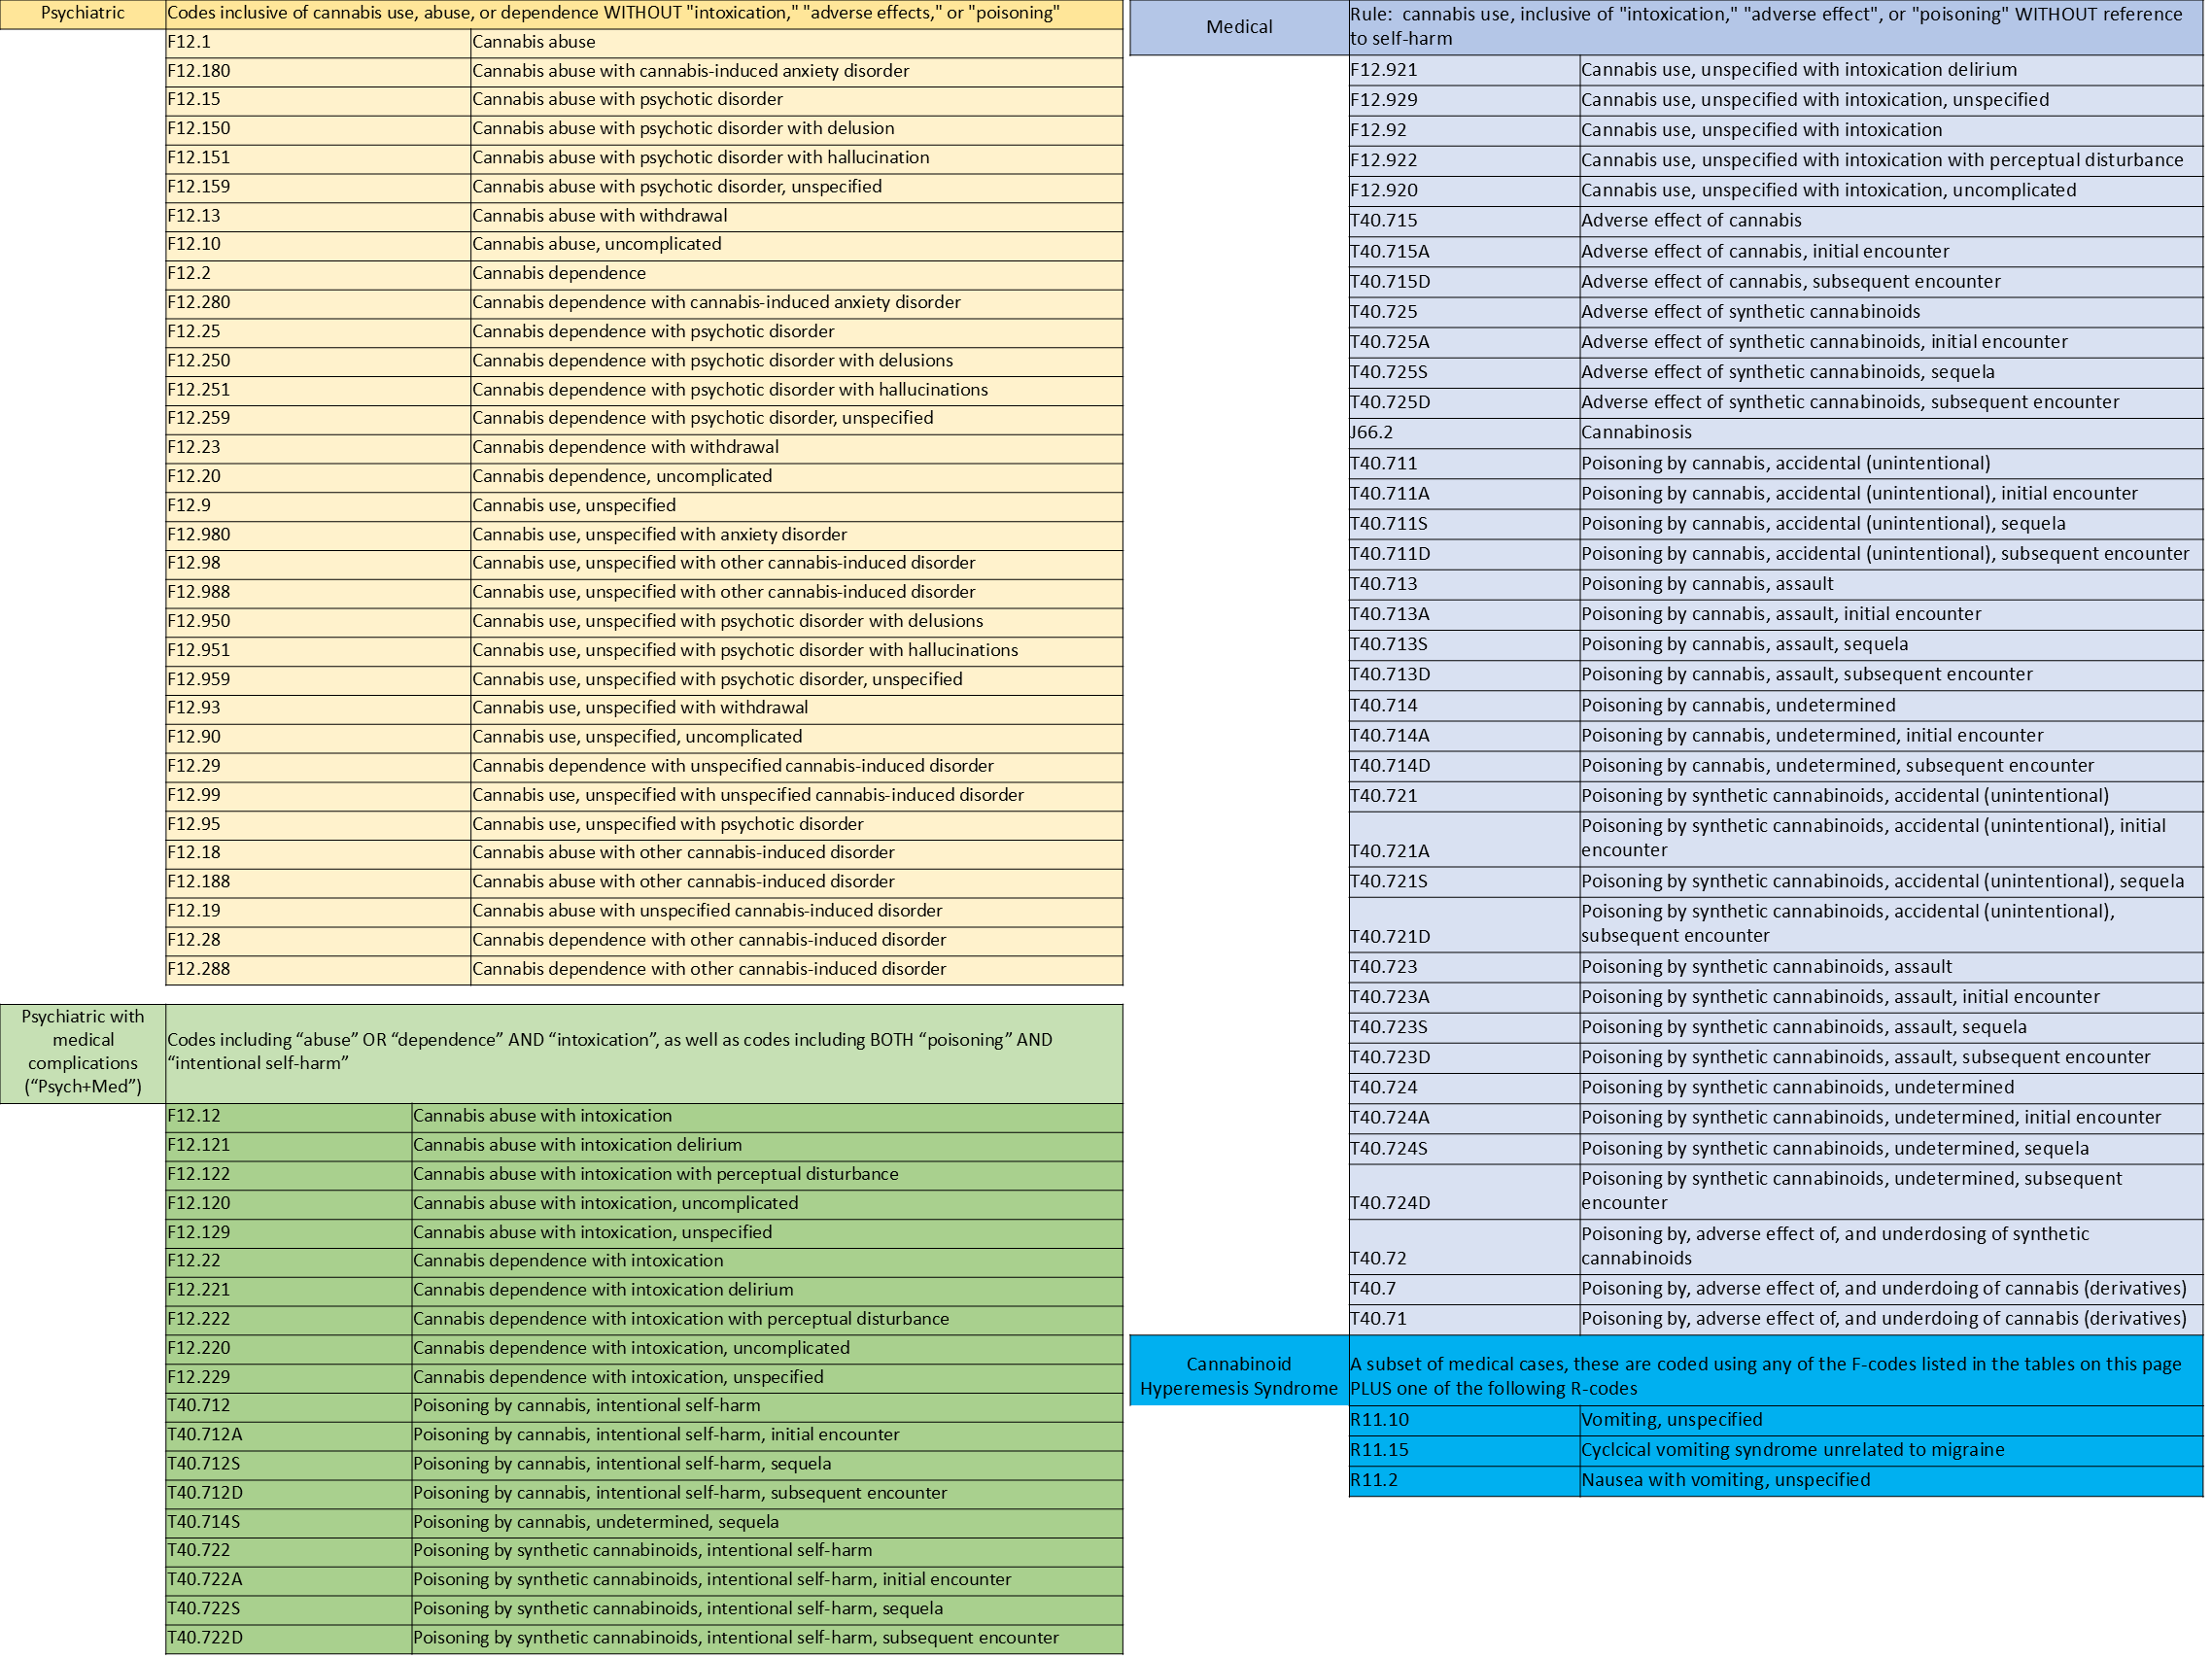 The above tables list the ICD-10 codes used to query the PHIS database for cannabis-associated encounters. Each table separates a category of the codes - medical, psychiatric, or combined medical/psychiatric - with a brief ruleset explaining how the codes were sorted. These categories were used to perform subgroup analyses for the cannabis-associated encounter rates in legal, not legal, and transitional states. Note the subset of medical codes designating cannabinoid hyperemesis.
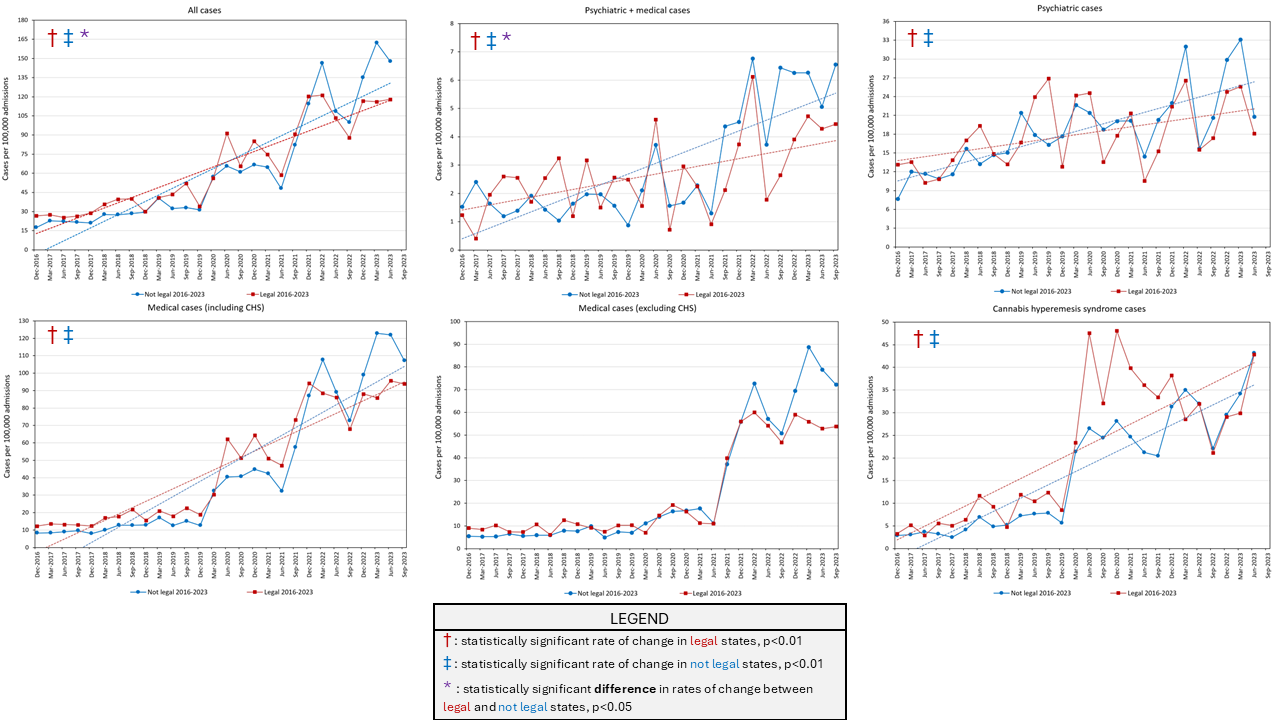 These six graphs indicate rates of change of cannabis-associated encounters in states where recreational marijuana has been legal since at least 2016 and states that have yet to legalize, in aggregate and separated into categories by ICD-10 codes (see TABLE for explanation of code categories). Linear regression for rates of change given by dashed lines. Regression not plotted for medical cases (excluding CHS) due to non-linearity. CHS = cannabinoid hyperemesis syndrome.
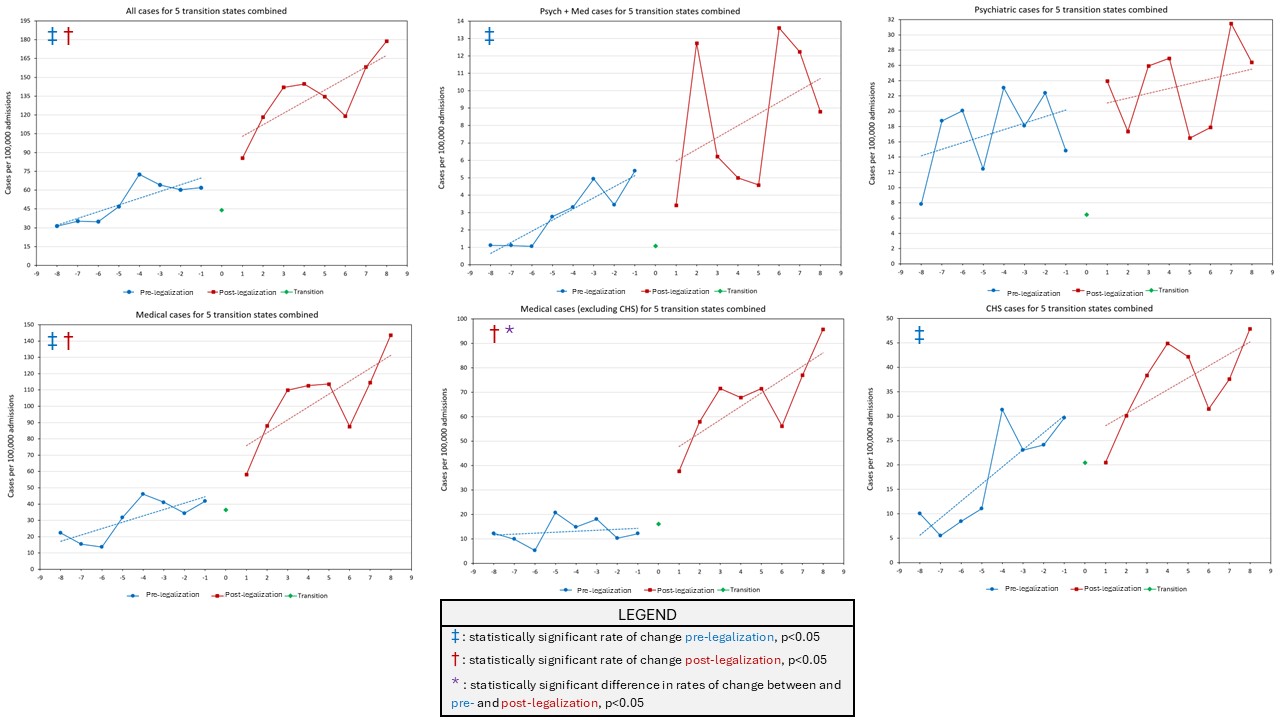 These six graphs indicate rates of change of cannabis-associated encounters in five states which legalized between 2016 and 2023, in aggregate and separated into categories by ICD-10 codes (see TABLE for explanation of code categories). Linear regression for rates of change given by dashed lines. T0= legalization date. X-axis intervals indicate number of 3-month periods pre-legalization (blue) or post-legalization (red). CHS = cannabinoid hyperemesis syndrome.