
Neonatal GI Physiology & NEC 4
Session: Neonatal GI Physiology & NEC 4
 photo")
Joanna Jain, B.S. (she/her/hers)
Clinical Research Coordinator Associate
Stanford University School of Medicine
Stanford, California, United States
.png) Patient demographics.
Patient demographics.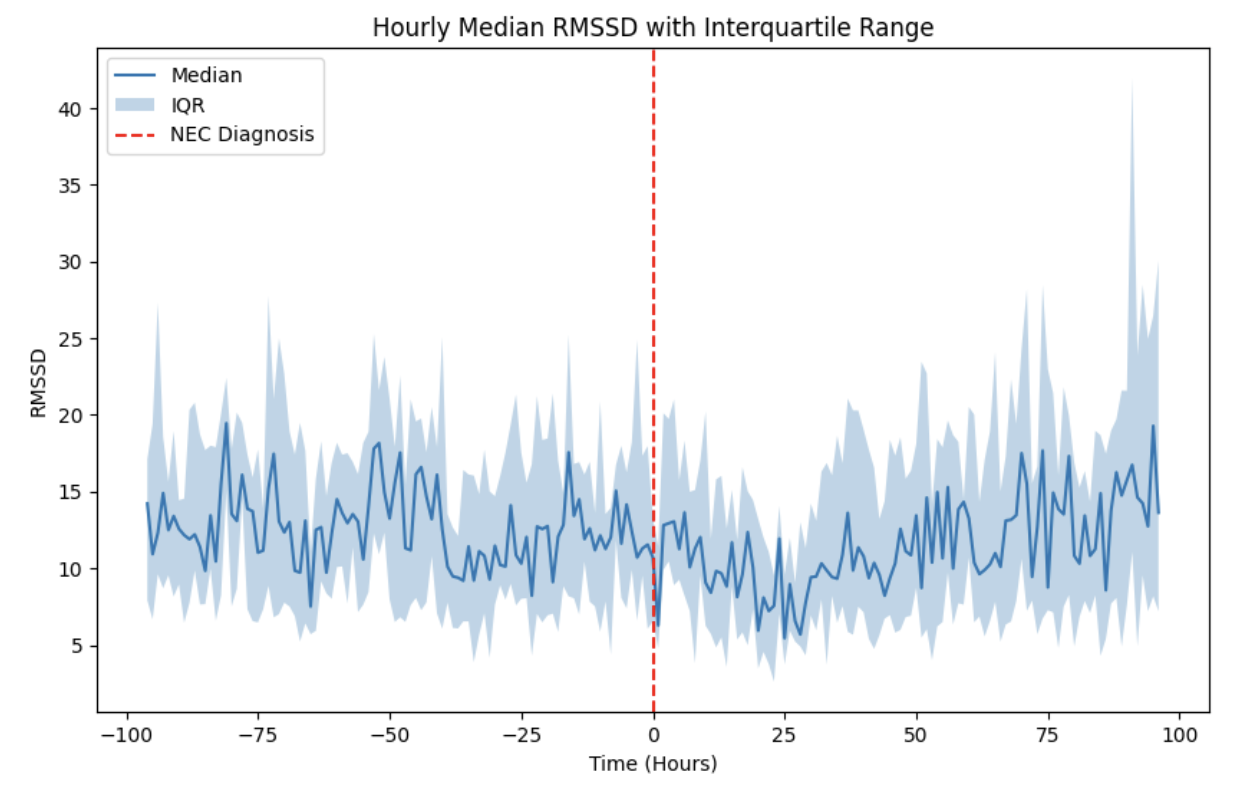 Hourly median RMSSD (in milliseconds) over an 8-day period before and after the diagnosis of medical (mNEC) or surgical NEC (sNEC). The solid blue line represents the median values, while the shaded area indicates the interquartile range (IQR). The dashed red line marks the time of NEC diagnosis.
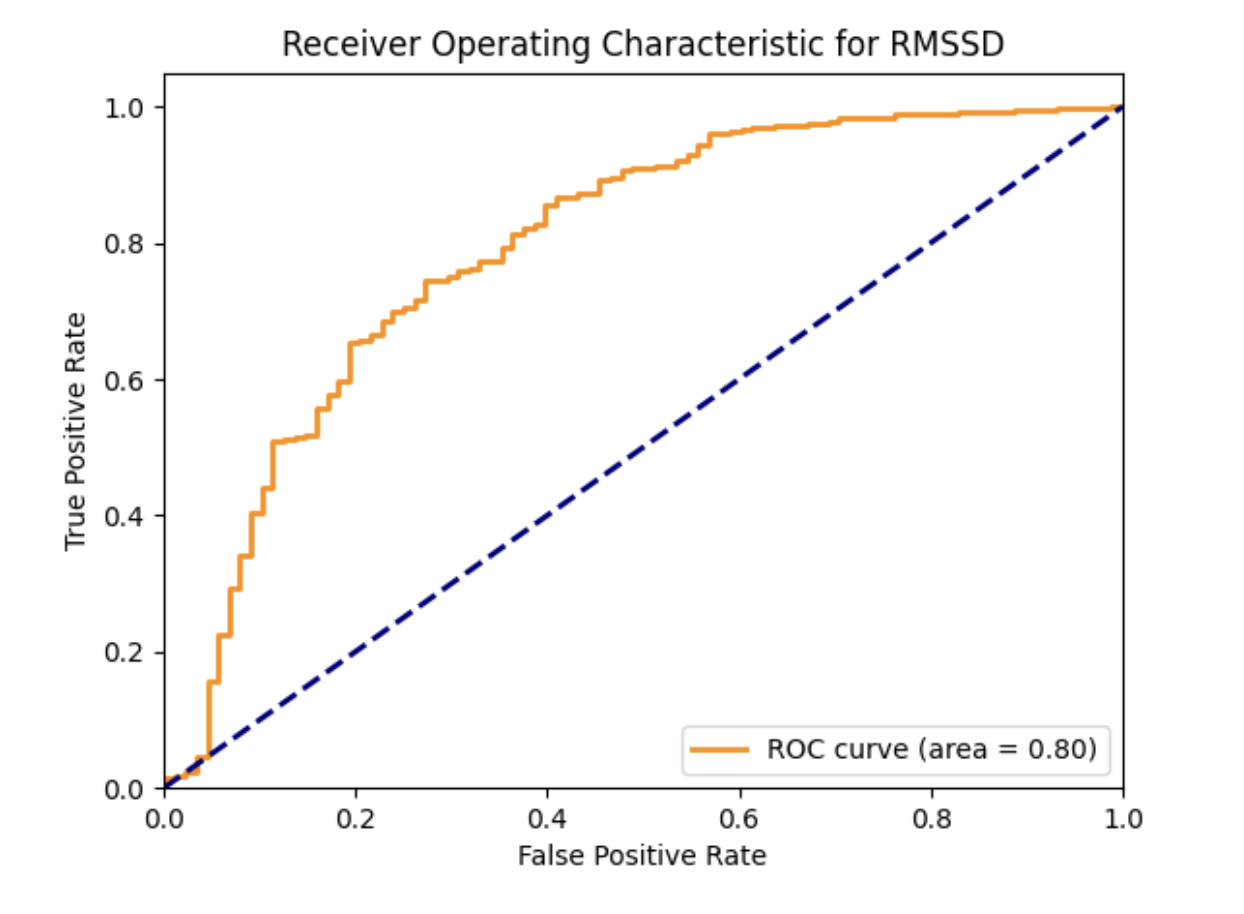 Represents the relationship between the true positive rate (sensitivity) and the false positive rate (1 - specificity) for different thresholds of RMSSD. The area under the ROC curve is 0.80, indicating good discriminatory ability in distinguishing between cases (mNEC and sNEC) and controls. Blue dashed line represents the baseline performance of a random classifier (no discrimination between classes).