
Neonatal GI Physiology & NEC 3
Session: Neonatal GI Physiology & NEC 3
Amy E. O'Connell, MD, PhD
Assistant Professor
Boston Children's Hospital
Harvard Medical School
Boston, Massachusetts, United States
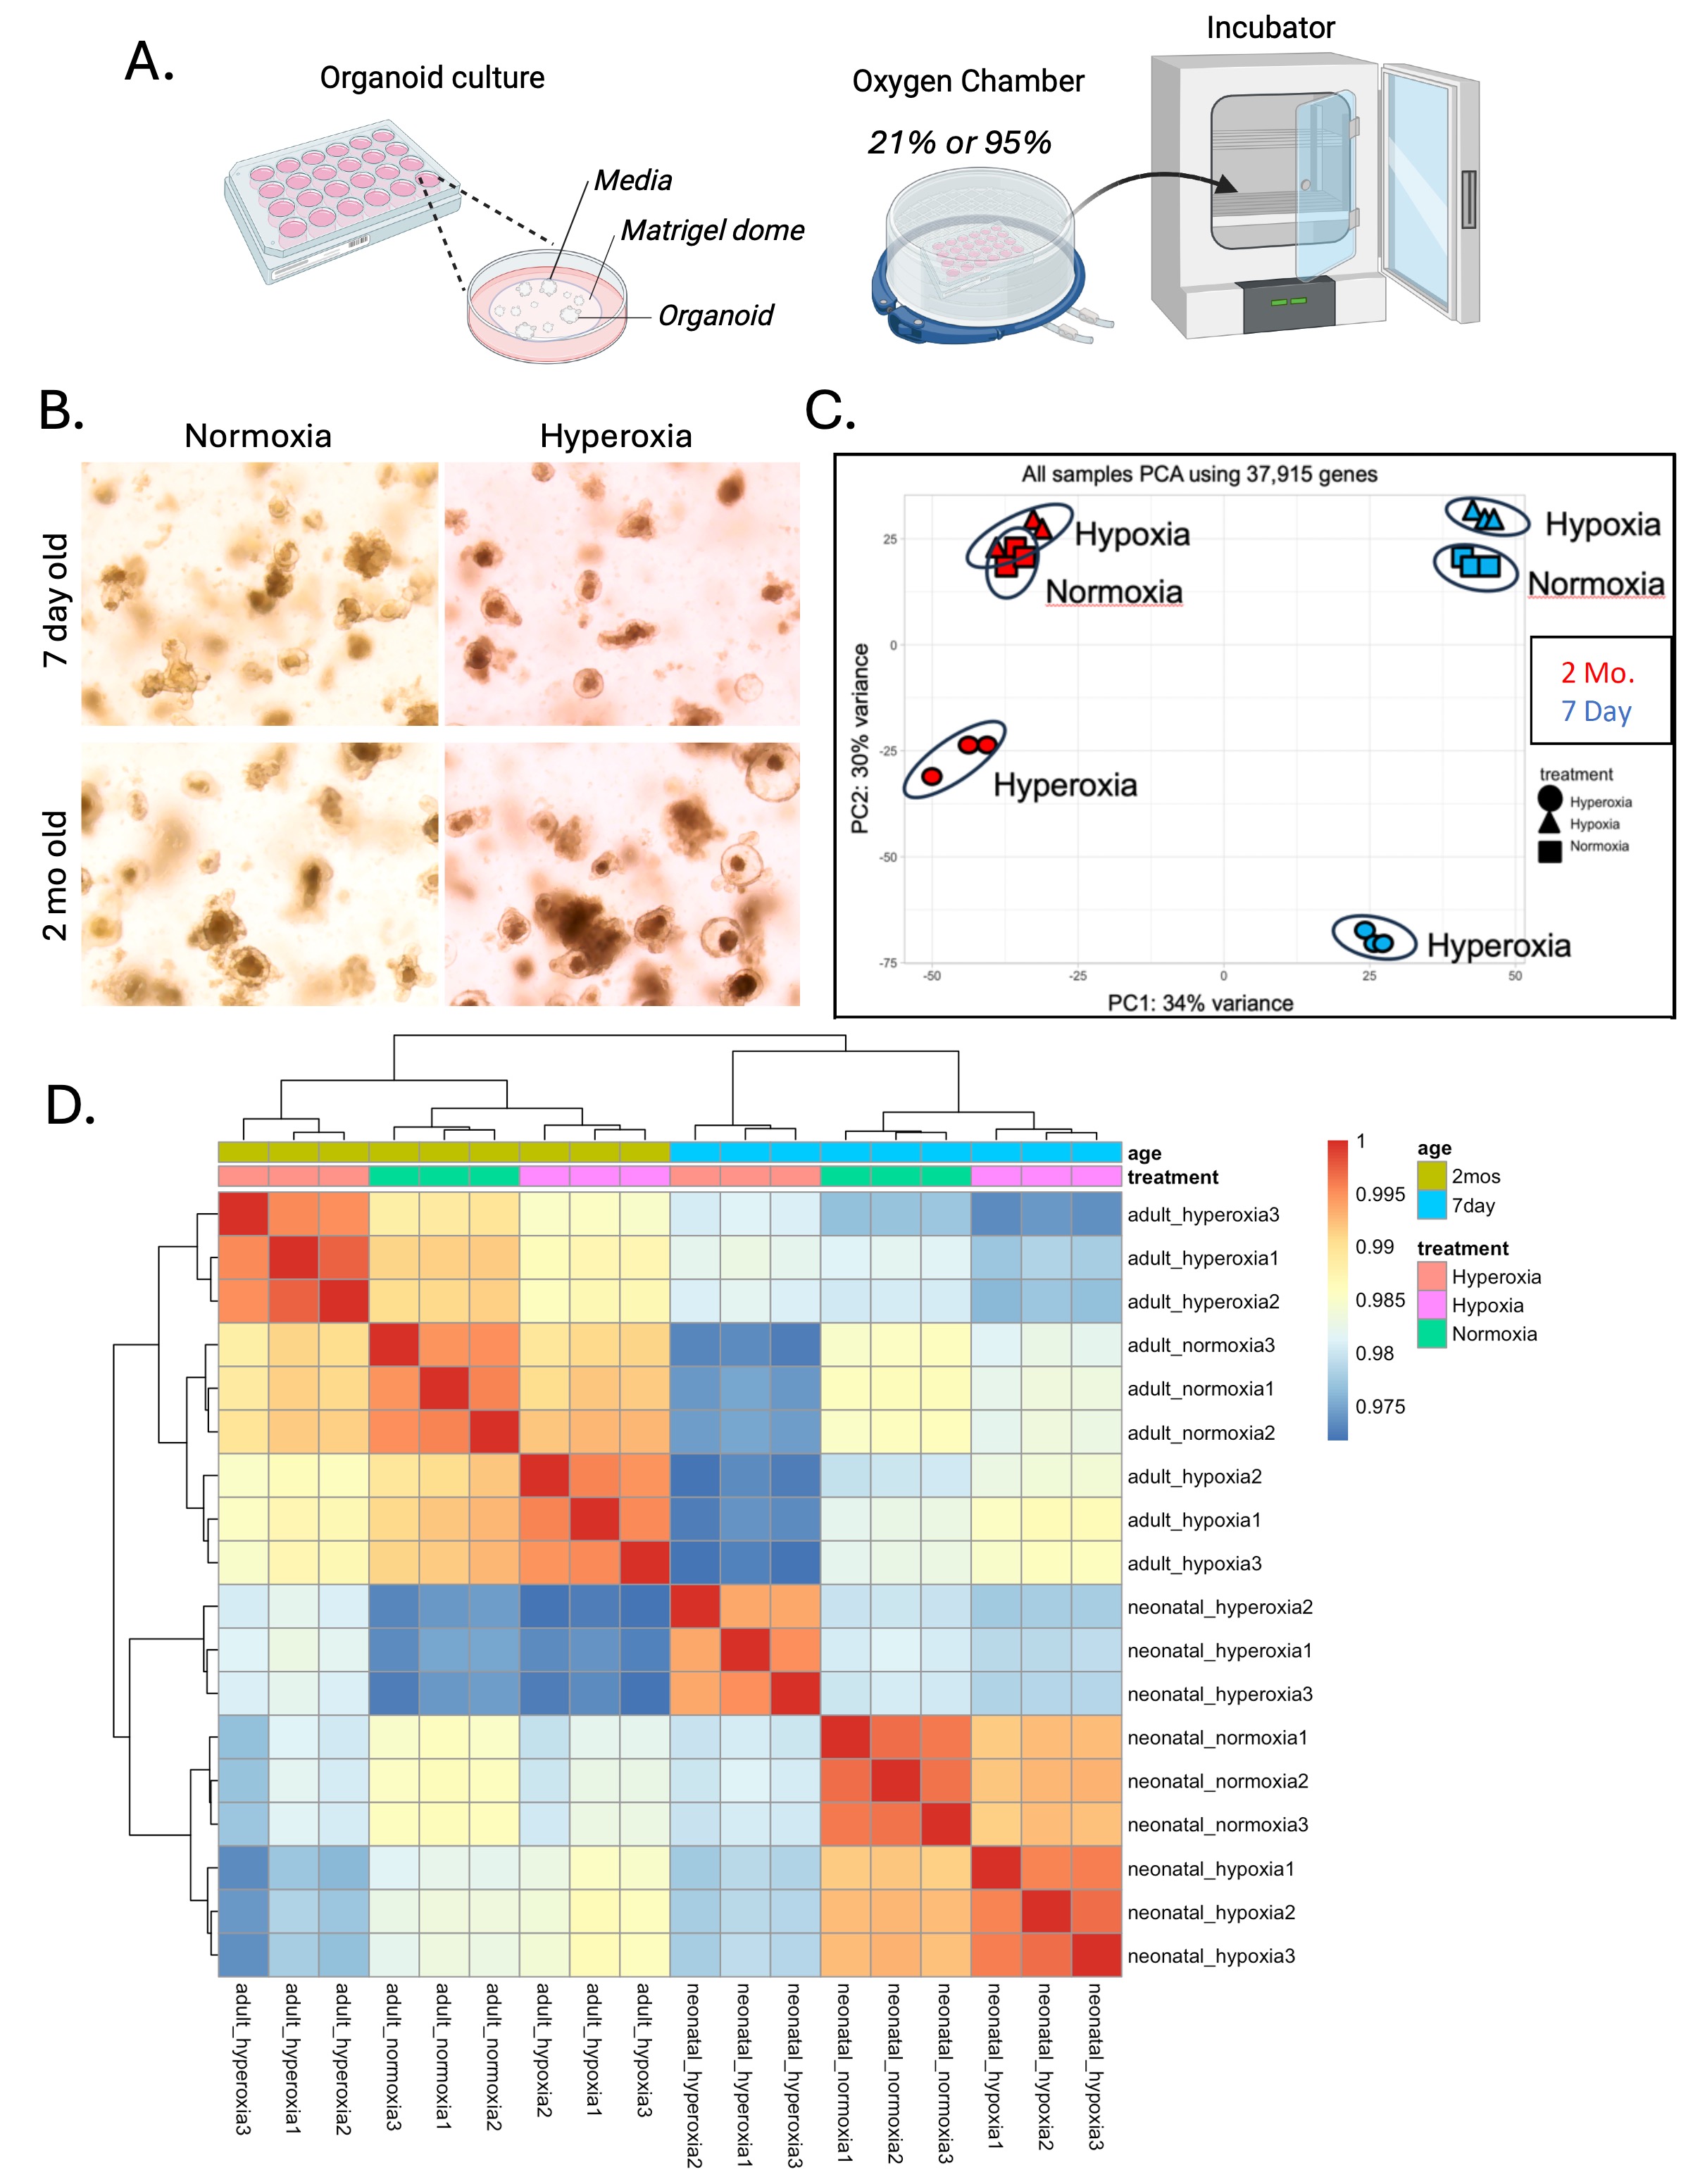 A.) Morphology of organoids in culture after 12 hours of normoxia or hyperoxia. B.) Principal component analysis of RNASeq data for ileum organoids from 7-day-old mice (blue) versus 2 month-old mice (red) under normoxia (squares), hypoxia (triangles) or hyperoxia (circles). C.) Hierarchical clustering of RNASeq data shows that immature hyperoxia samples clustered independently of all other groups.
 .jpg) A.) Heat maps of key epithelial subset genes form RNASeq in 7-day-old and 2-month-old ileal organoids treated with normoxia (NO) or hyperoxia (HO). B.) qRT-PCR confirmation of A. for Lgr5 and Lyz1 expression. C. Morphology of human organoids from 22-week fetus or 37-week infant after exposure to 12 hours of normoxia (21%) or hyperoxia (95%). D.) RNA expression in hyperoxia treated human organoids. E.) Heatmap of expression of genes important for nutrient transport and absorption in the intestine after normoxia or hyperoxia (HO) exposure. * indicates p <0.05 (or adjusted p-value <0.005 for A and E), *** p < 0.001.
A.) Heat maps of key epithelial subset genes form RNASeq in 7-day-old and 2-month-old ileal organoids treated with normoxia (NO) or hyperoxia (HO). B.) qRT-PCR confirmation of A. for Lgr5 and Lyz1 expression. C. Morphology of human organoids from 22-week fetus or 37-week infant after exposure to 12 hours of normoxia (21%) or hyperoxia (95%). D.) RNA expression in hyperoxia treated human organoids. E.) Heatmap of expression of genes important for nutrient transport and absorption in the intestine after normoxia or hyperoxia (HO) exposure. * indicates p <0.05 (or adjusted p-value <0.005 for A and E), *** p < 0.001..jpg) A.) Schematic of mouse hyperoxia experiment. B.) Body weights at start and end of experiment, as well as gross organ measurements. C.) RNA expression by qRT-PCR of control normoxia mice (NO) versus hyperoxia exposed mice (HO). ** p <0.01.A.) Morphology of organoids in culture after 12 hours of normoxia or hyperoxia. B.) Principal component analysis of RNASeq data for ileum organoids from 7-day-old mice (blue) versus 2 month-old mice (red) under normoxia (squares), hypoxia (triangles) or hyperoxia (circles). C.) Hierarchical clustering of RNASeq data shows that immature hyperoxia samples clustered independently of all other groups. A.) Heat maps of key epithelial subset genes form RNASeq in 7-day-old and 2-month-old ileal organoids treated with normoxia (NO) or hyperoxia (HO). B.) qRT-PCR confirmation of A. for Lgr5 and Lyz1 expression. C. Morphology of human organoids from 22-week fetus or 37-week infant after exposure to 12 hours of normoxia (21%) or hyperoxia (95%). D.) RNA expression in hyperoxia treated human organoids. E.) Heatmap of expression of genes important for nutrient transport and absorption in the intestine after normoxia or hyperoxia (HO) exposure. * indicates p <0.05 (or adjusted p-value <0.005 for A and E), *** p < 0.001.A.) Schematic of mouse hyperoxia experiment. B.) Body weights at start and end of experiment, as well as gross organ measurements. C.) RNA expression by qRT-PCR of control normoxia mice (NO) versus hyperoxia exposed mice (HO). ** p <0.01.
A.) Schematic of mouse hyperoxia experiment. B.) Body weights at start and end of experiment, as well as gross organ measurements. C.) RNA expression by qRT-PCR of control normoxia mice (NO) versus hyperoxia exposed mice (HO). ** p <0.01.A.) Morphology of organoids in culture after 12 hours of normoxia or hyperoxia. B.) Principal component analysis of RNASeq data for ileum organoids from 7-day-old mice (blue) versus 2 month-old mice (red) under normoxia (squares), hypoxia (triangles) or hyperoxia (circles). C.) Hierarchical clustering of RNASeq data shows that immature hyperoxia samples clustered independently of all other groups. A.) Heat maps of key epithelial subset genes form RNASeq in 7-day-old and 2-month-old ileal organoids treated with normoxia (NO) or hyperoxia (HO). B.) qRT-PCR confirmation of A. for Lgr5 and Lyz1 expression. C. Morphology of human organoids from 22-week fetus or 37-week infant after exposure to 12 hours of normoxia (21%) or hyperoxia (95%). D.) RNA expression in hyperoxia treated human organoids. E.) Heatmap of expression of genes important for nutrient transport and absorption in the intestine after normoxia or hyperoxia (HO) exposure. * indicates p <0.05 (or adjusted p-value <0.005 for A and E), *** p < 0.001.A.) Schematic of mouse hyperoxia experiment. B.) Body weights at start and end of experiment, as well as gross organ measurements. C.) RNA expression by qRT-PCR of control normoxia mice (NO) versus hyperoxia exposed mice (HO). ** p <0.01.