
Neonatal Hematology & Bilirubin Metabolism 2
Session: Neonatal Hematology & Bilirubin Metabolism 2

Eric A. Tano, MD
Neonatology Fellow
UH Rainbow Babies & Children's Hospital
Coral Gables, Florida, United States
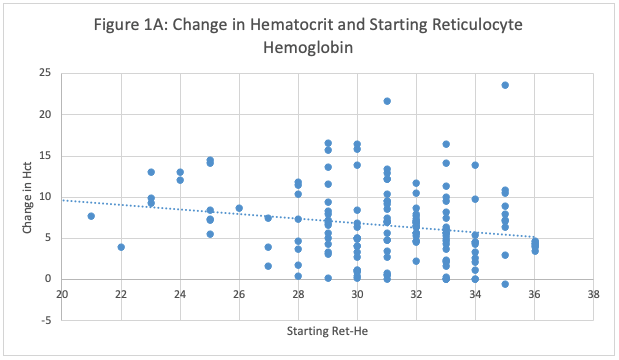 Figure 1A: Relationship Between Baseline Reticulocyte Hemoglobin (Ret-He) and Hematocrit (Hct) Increase in Preterm Infants Treated with 300 u/kg EPO. The figure illustrates the change in hematocrit levels relative to initial reticulocyte hemoglobin values, which serve as an indicator of iron stores. Contrary to expectations, a higher starting reticulocyte hemoglobin level was associated with a lower rise in hematocrit (P <0.0001, by linear regression).
 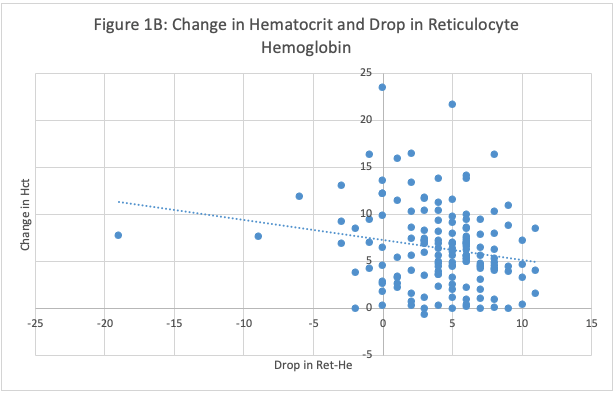 Figure 1B: Association Between Rise in Hematocrit and Drop in Reticulocyte Hemoglobin in Preterm Infants Treated with 300 u/kg EPO. Higher hematocrit responses were associated with a greater decrease in Ret-He (P=0.0101, by linear regression).
  Figure 1A: Relationship Between Baseline Reticulocyte Hemoglobin (Ret-He) and Hematocrit (Hct) Increase in Preterm Infants Treated with 300 u/kg EPO. The figure illustrates the change in hematocrit levels relative to initial reticulocyte hemoglobin values, which serve as an indicator of iron stores. Contrary to expectations, a higher starting reticulocyte hemoglobin level was associated with a lower rise in hematocrit (P <0.0001, by linear regression). Figure 1B: Association Between Rise in Hematocrit and Drop in Reticulocyte Hemoglobin in Preterm Infants Treated with 300 u/kg EPO. Higher hematocrit responses were associated with a greater decrease in Ret-He (P=0.0101, by linear regression).