
Emergency Medicine 1
Session: Emergency Medicine 1

Kenneth Michelson, MD MPH
Associate Professor
Lurie Children's Hospital
Chicago, Illinois, United States
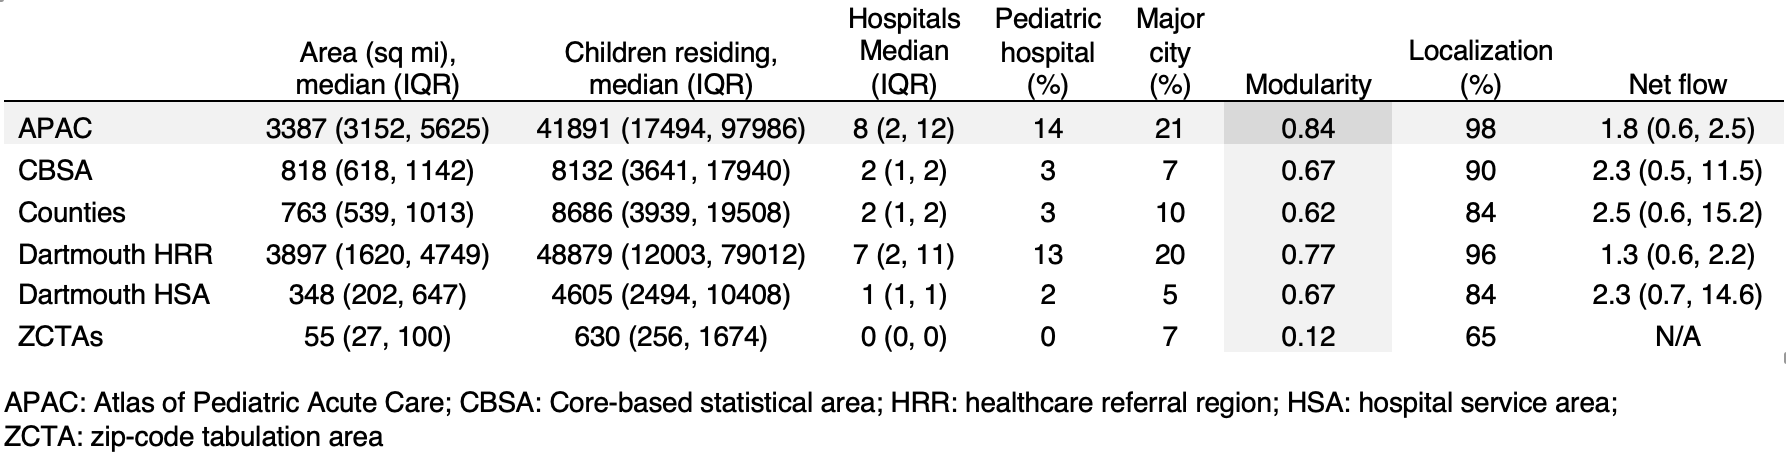 Demographics and quality measures of regions. Modularity is a score from 0 to 1 that tests how optimally region assignments capture flow patterns. Major cities were defined as having a population of at least 100,000.
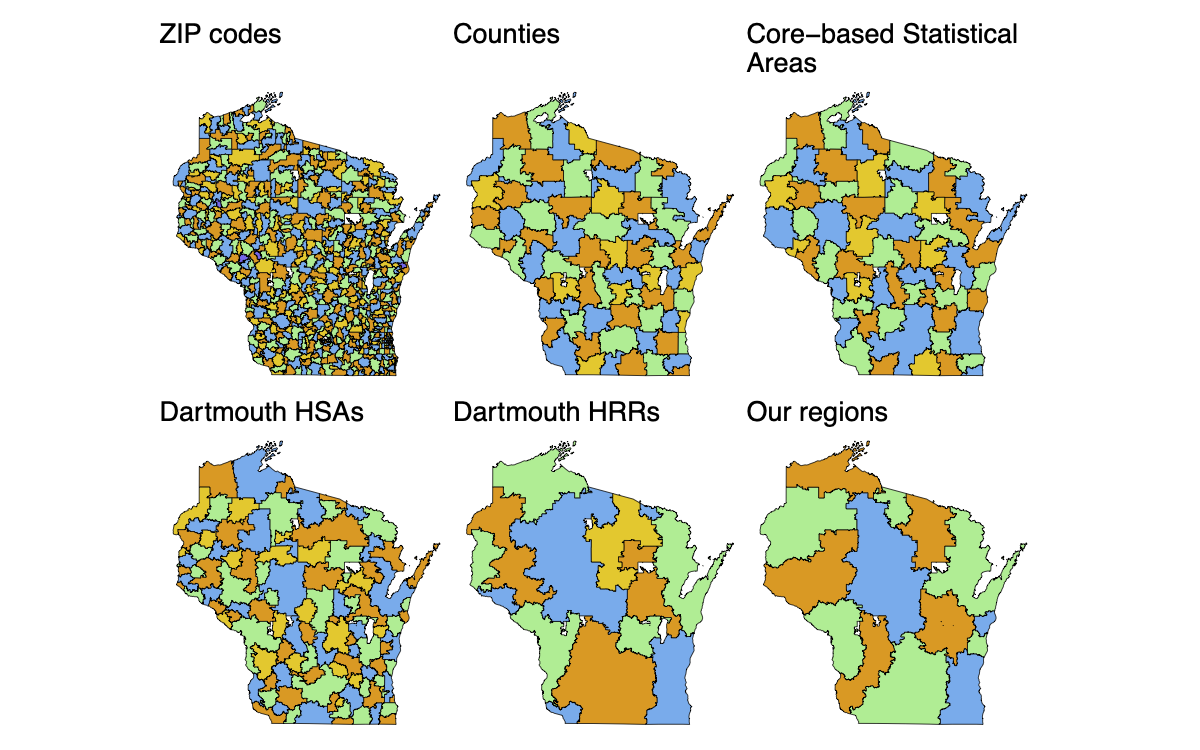
 Utilization patterns in Wisconsin and regional borders from our proposed new system. Black segments represent flow of children from ZCTAs to hospitals.Demographics and quality measures of regions. Modularity is a score from 0 to 1 that tests how optimally region assignments capture flow patterns. Major cities were defined as having a population of at least 100,000.Utilization patterns in Wisconsin and regional borders from our proposed new system. Black segments represent flow of children from ZCTAs to hospitals.