
Neonatal Pulmonology - Basic/Translational Science 1
Session: Neonatal Pulmonology - Basic/Translational Science 1
 photo")
THAYBETH I. MALAVE-MENDEZ, BSc (she/her/hers)
Graduate Student
University of California, San Francisco, School of Medicine
San Francisco, California, United States
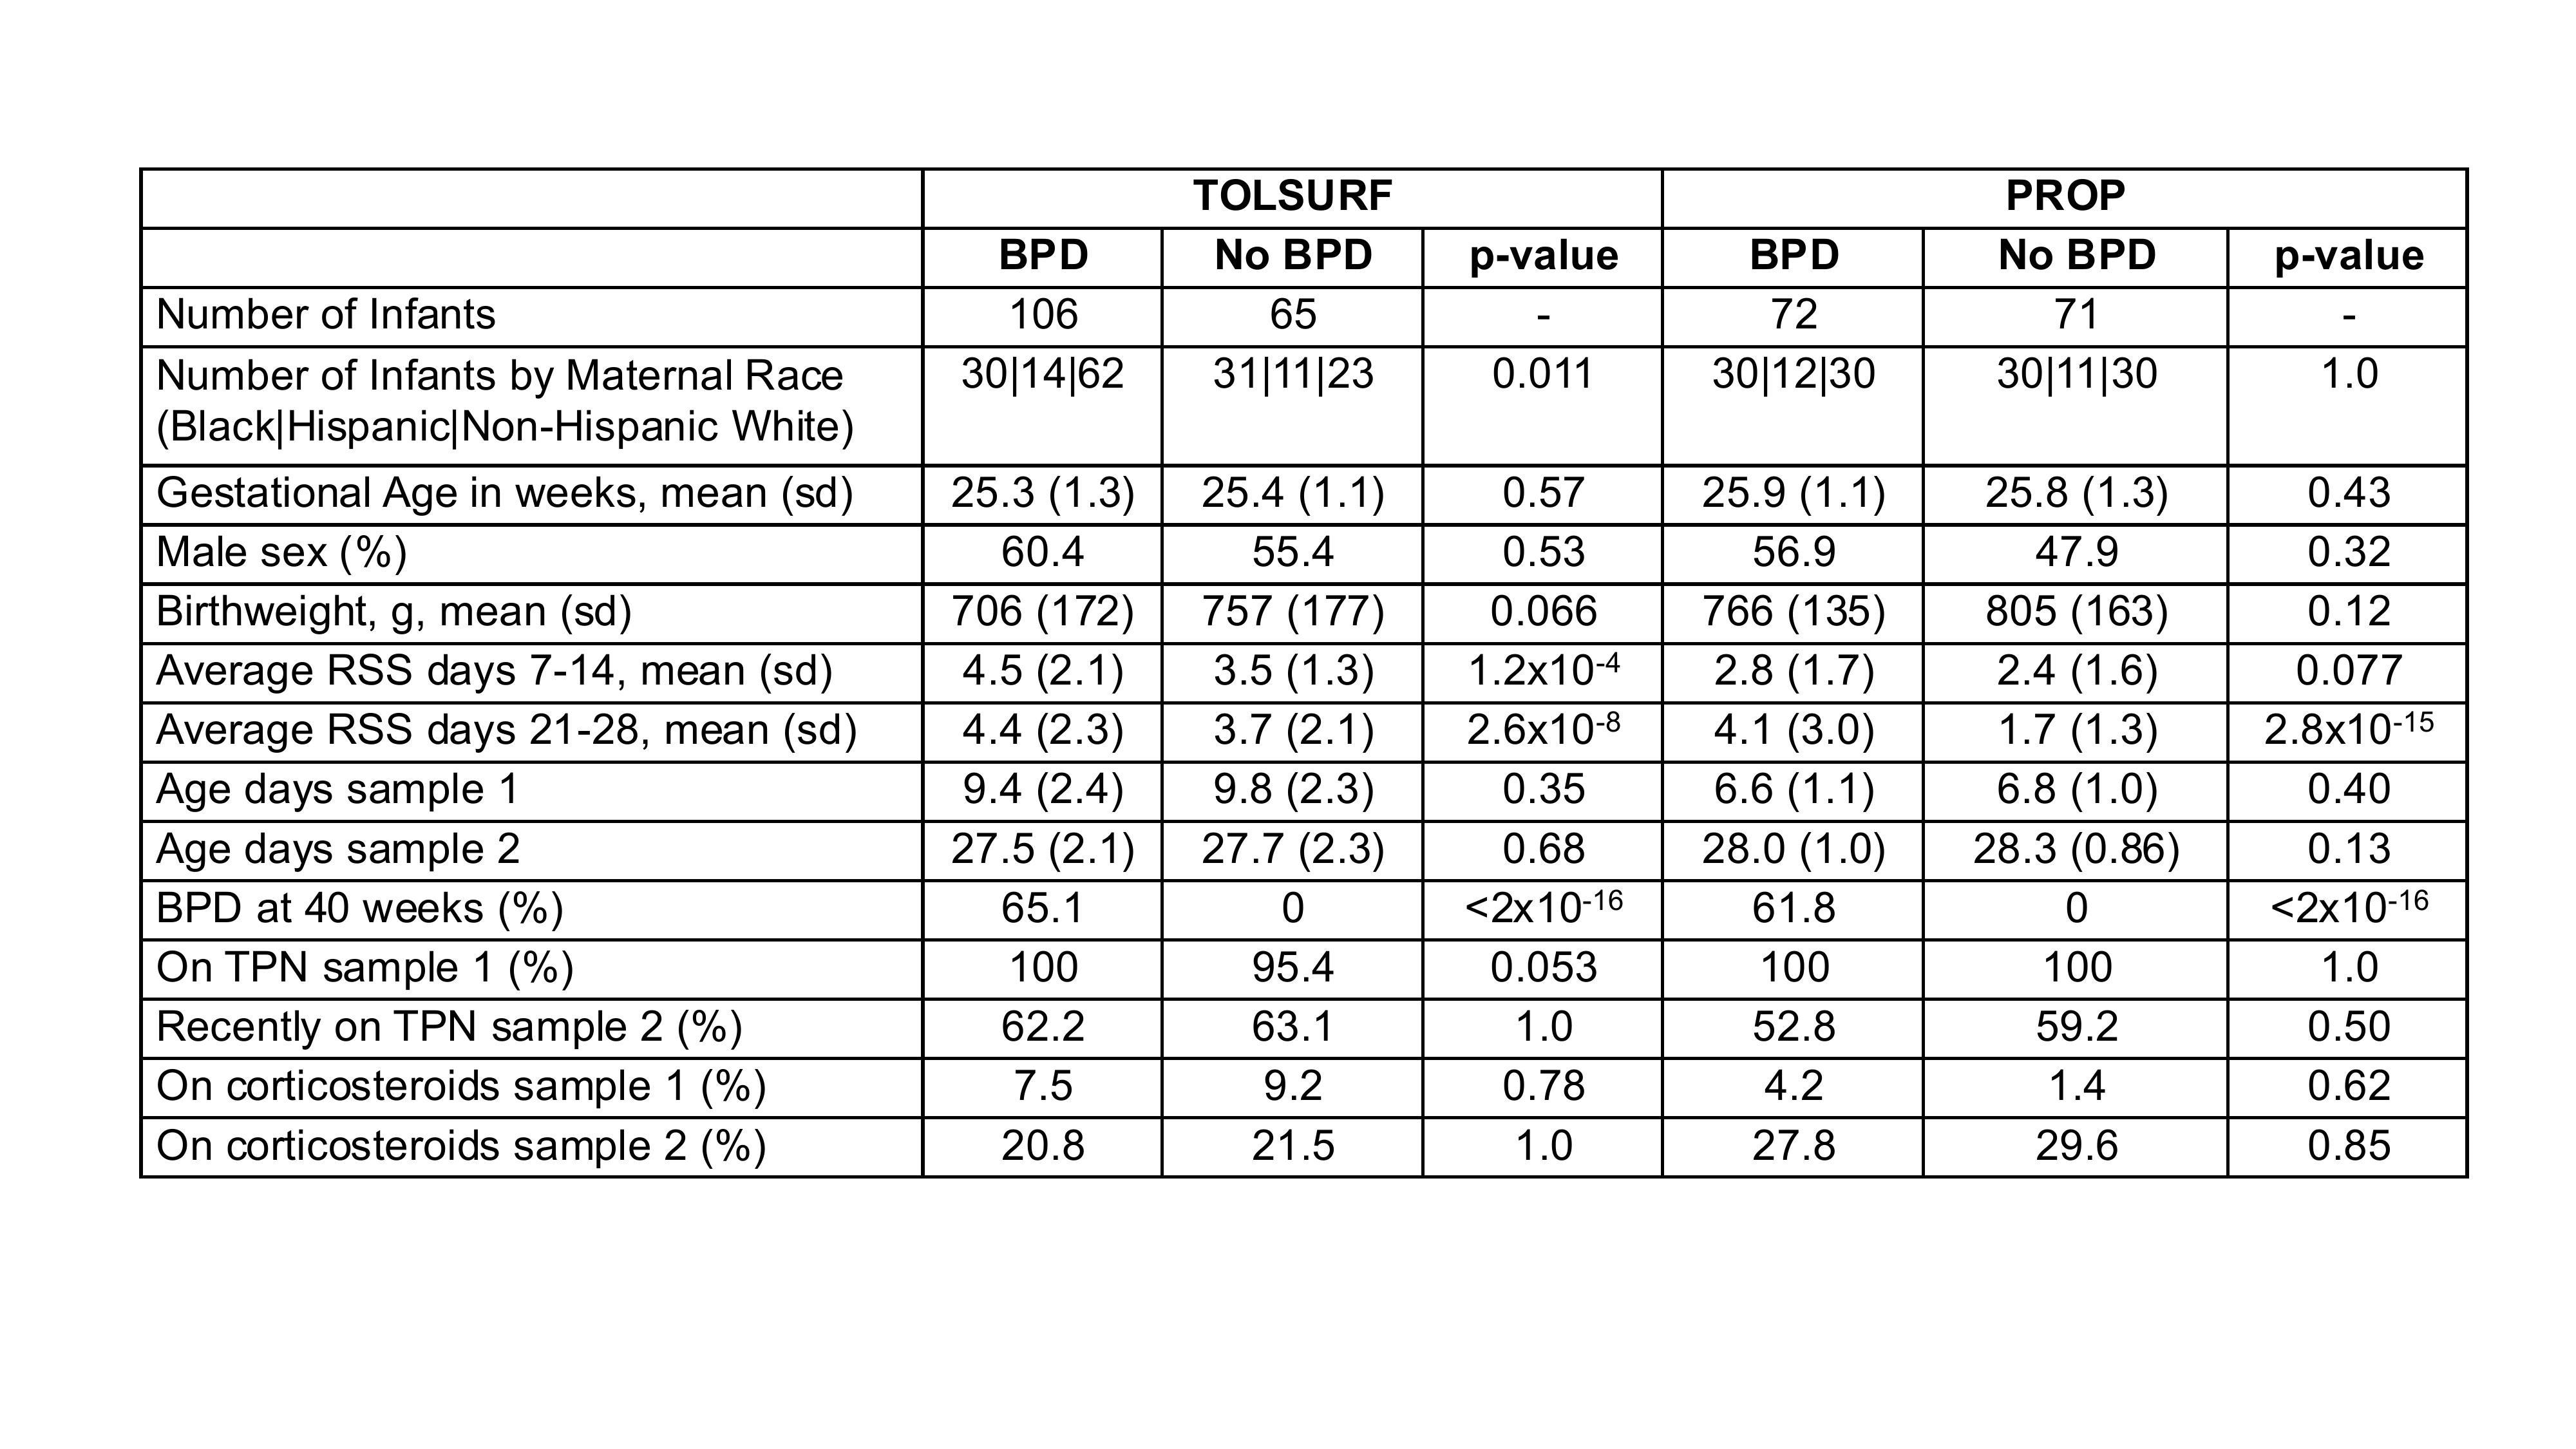 Quantitative measurements were compared using a t-test, and categorical data were compared using a Fisher’s Exact test.
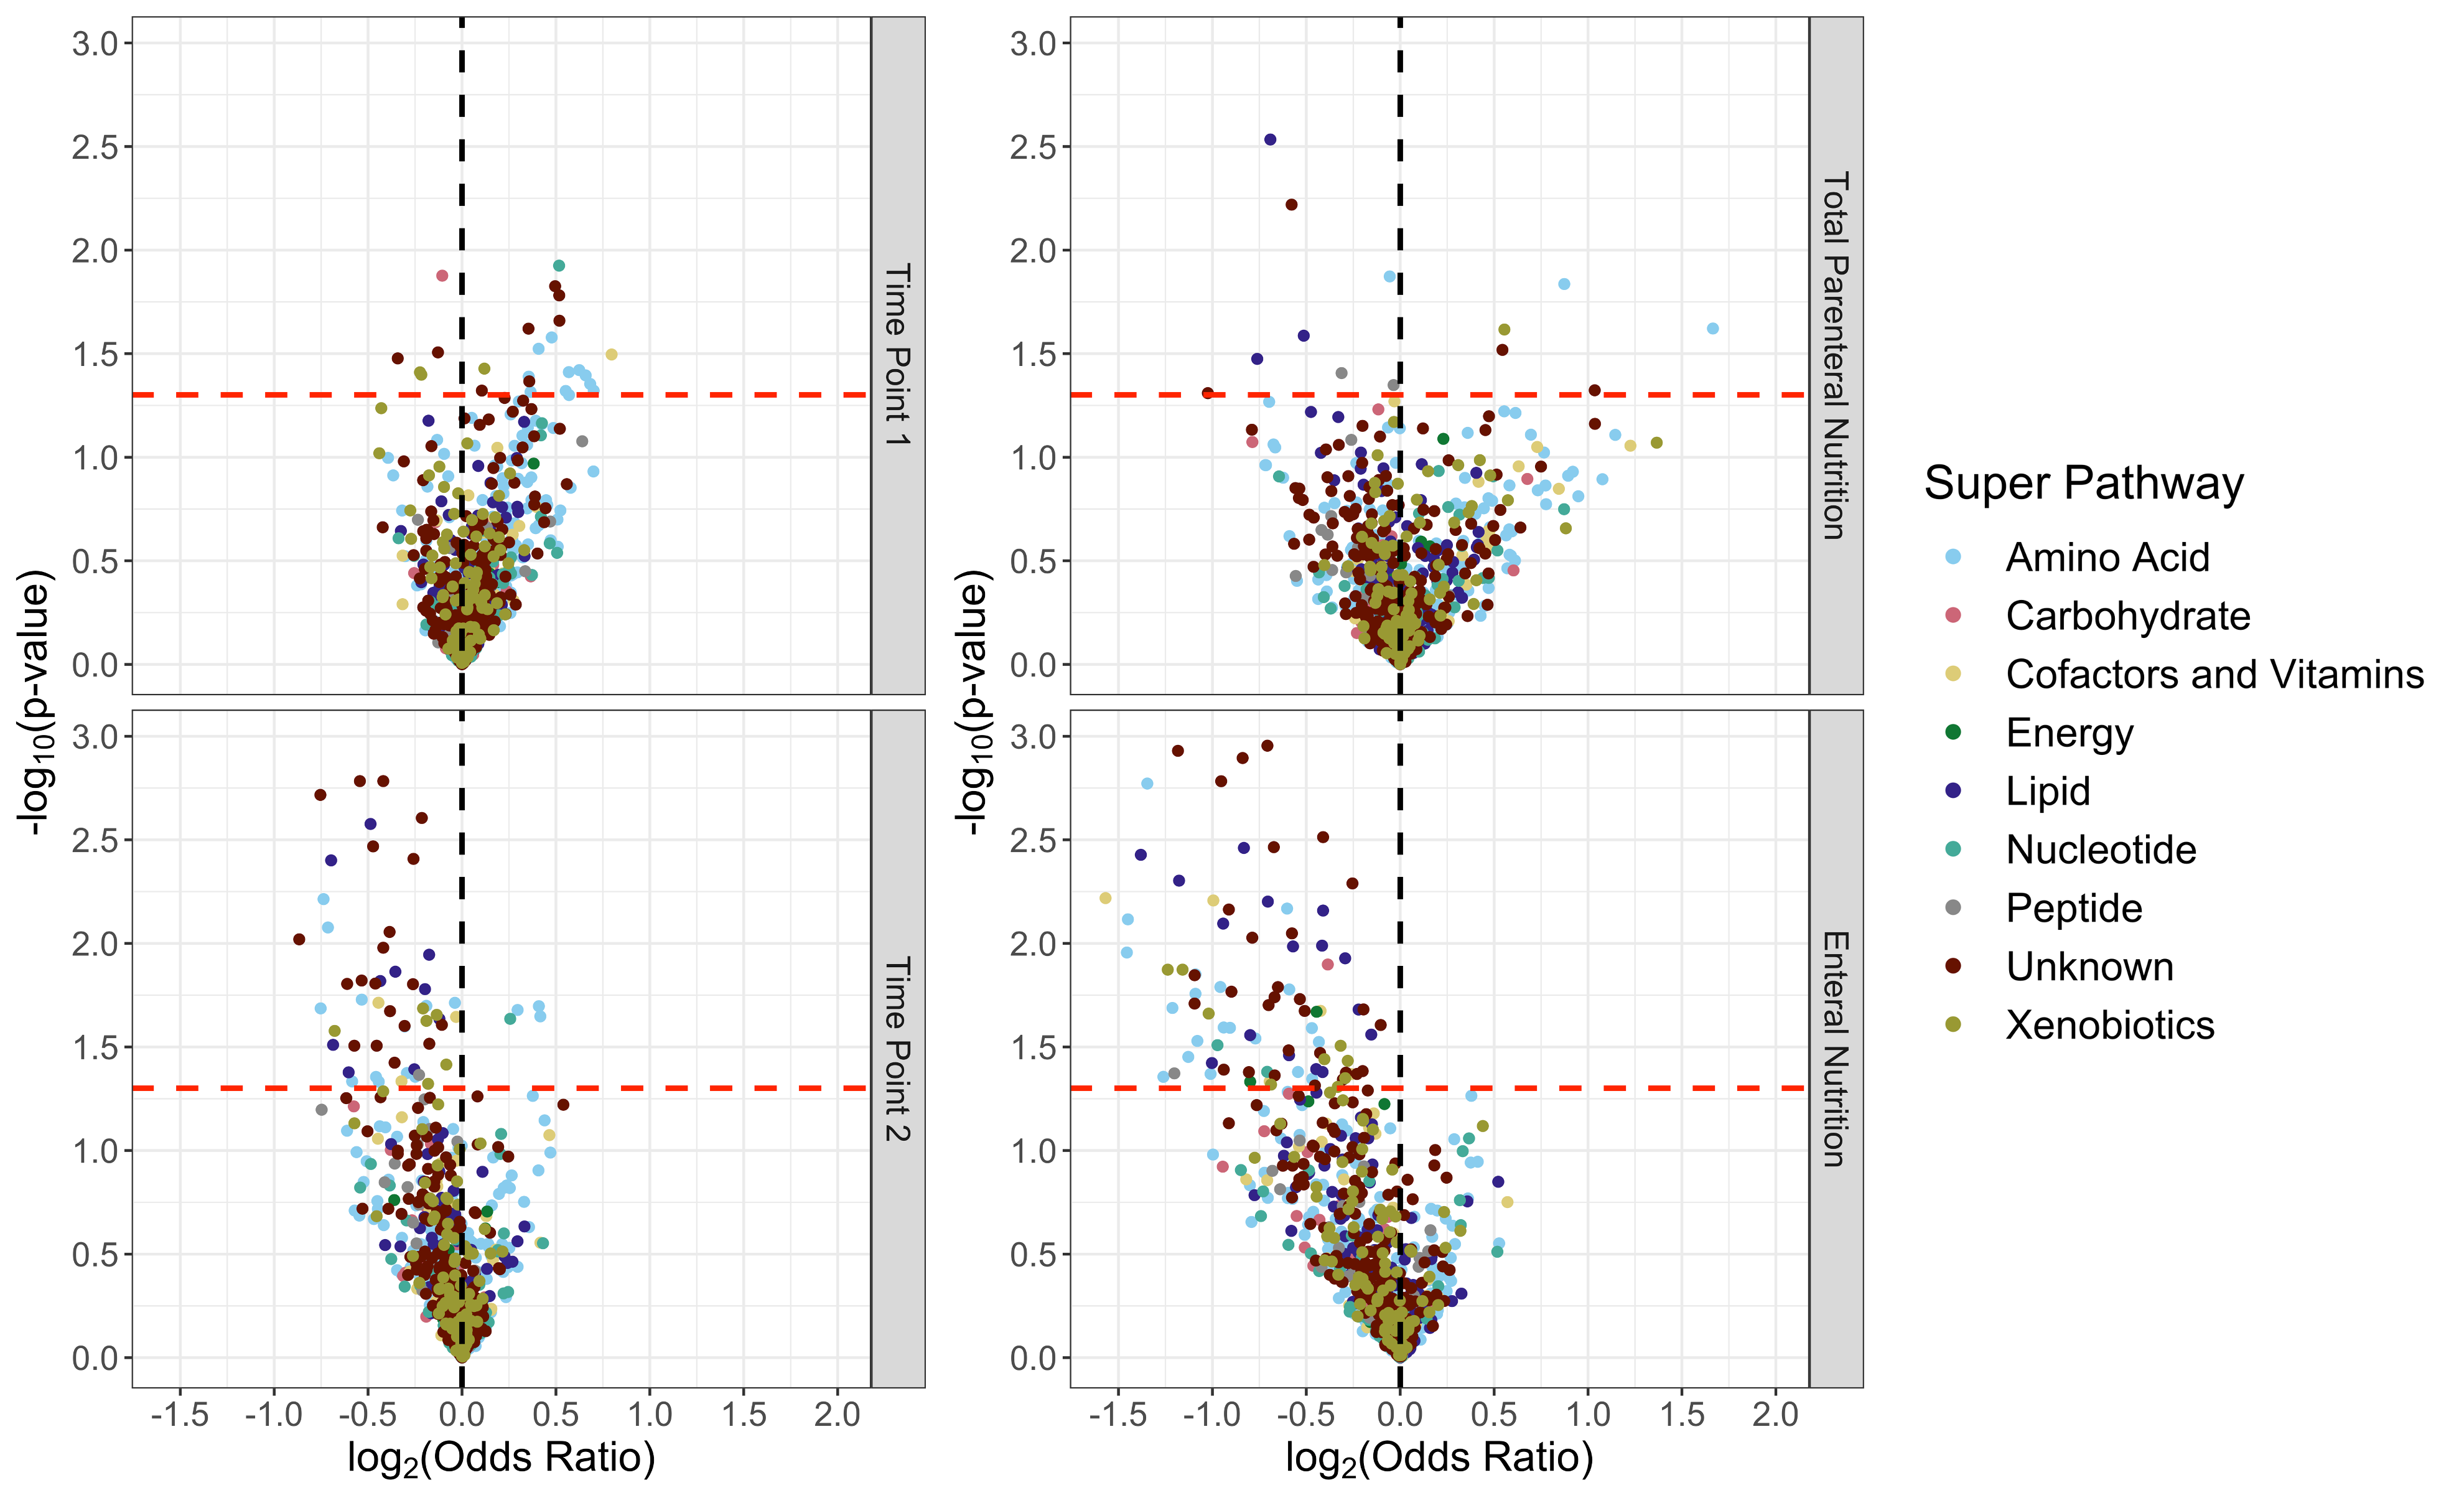 The dashed red line represents p < 0.05 and the dashed black line divides metabolites higher in infants that developed BPD (log2(OR) > 0) from those higher in infants that did not develop BPD (log2(OR) < 0). Each individual metabolite is represented as a dot colored by super pathway. These plots present that there are multiple metabolites whose levels vary significantly between infants with and without BDP early after birth. Additionally, it shows that the dysregulation at time point 2 is even more pronounced when infants are stratified by nutrition source, with most of the differing metabolites being at lower levels in infants who develop BPD.