
Cardiology 3
Session: Cardiology 3
.jpg "Angela C. Zeigler, MD PhD (she/her/hers) photo")
Angela C. Zeigler, MD PhD (she/her/hers)
Pediatric Critical Care Fellow
UCLA Mattel Childrens Hospital
Santa Monica, California, United States
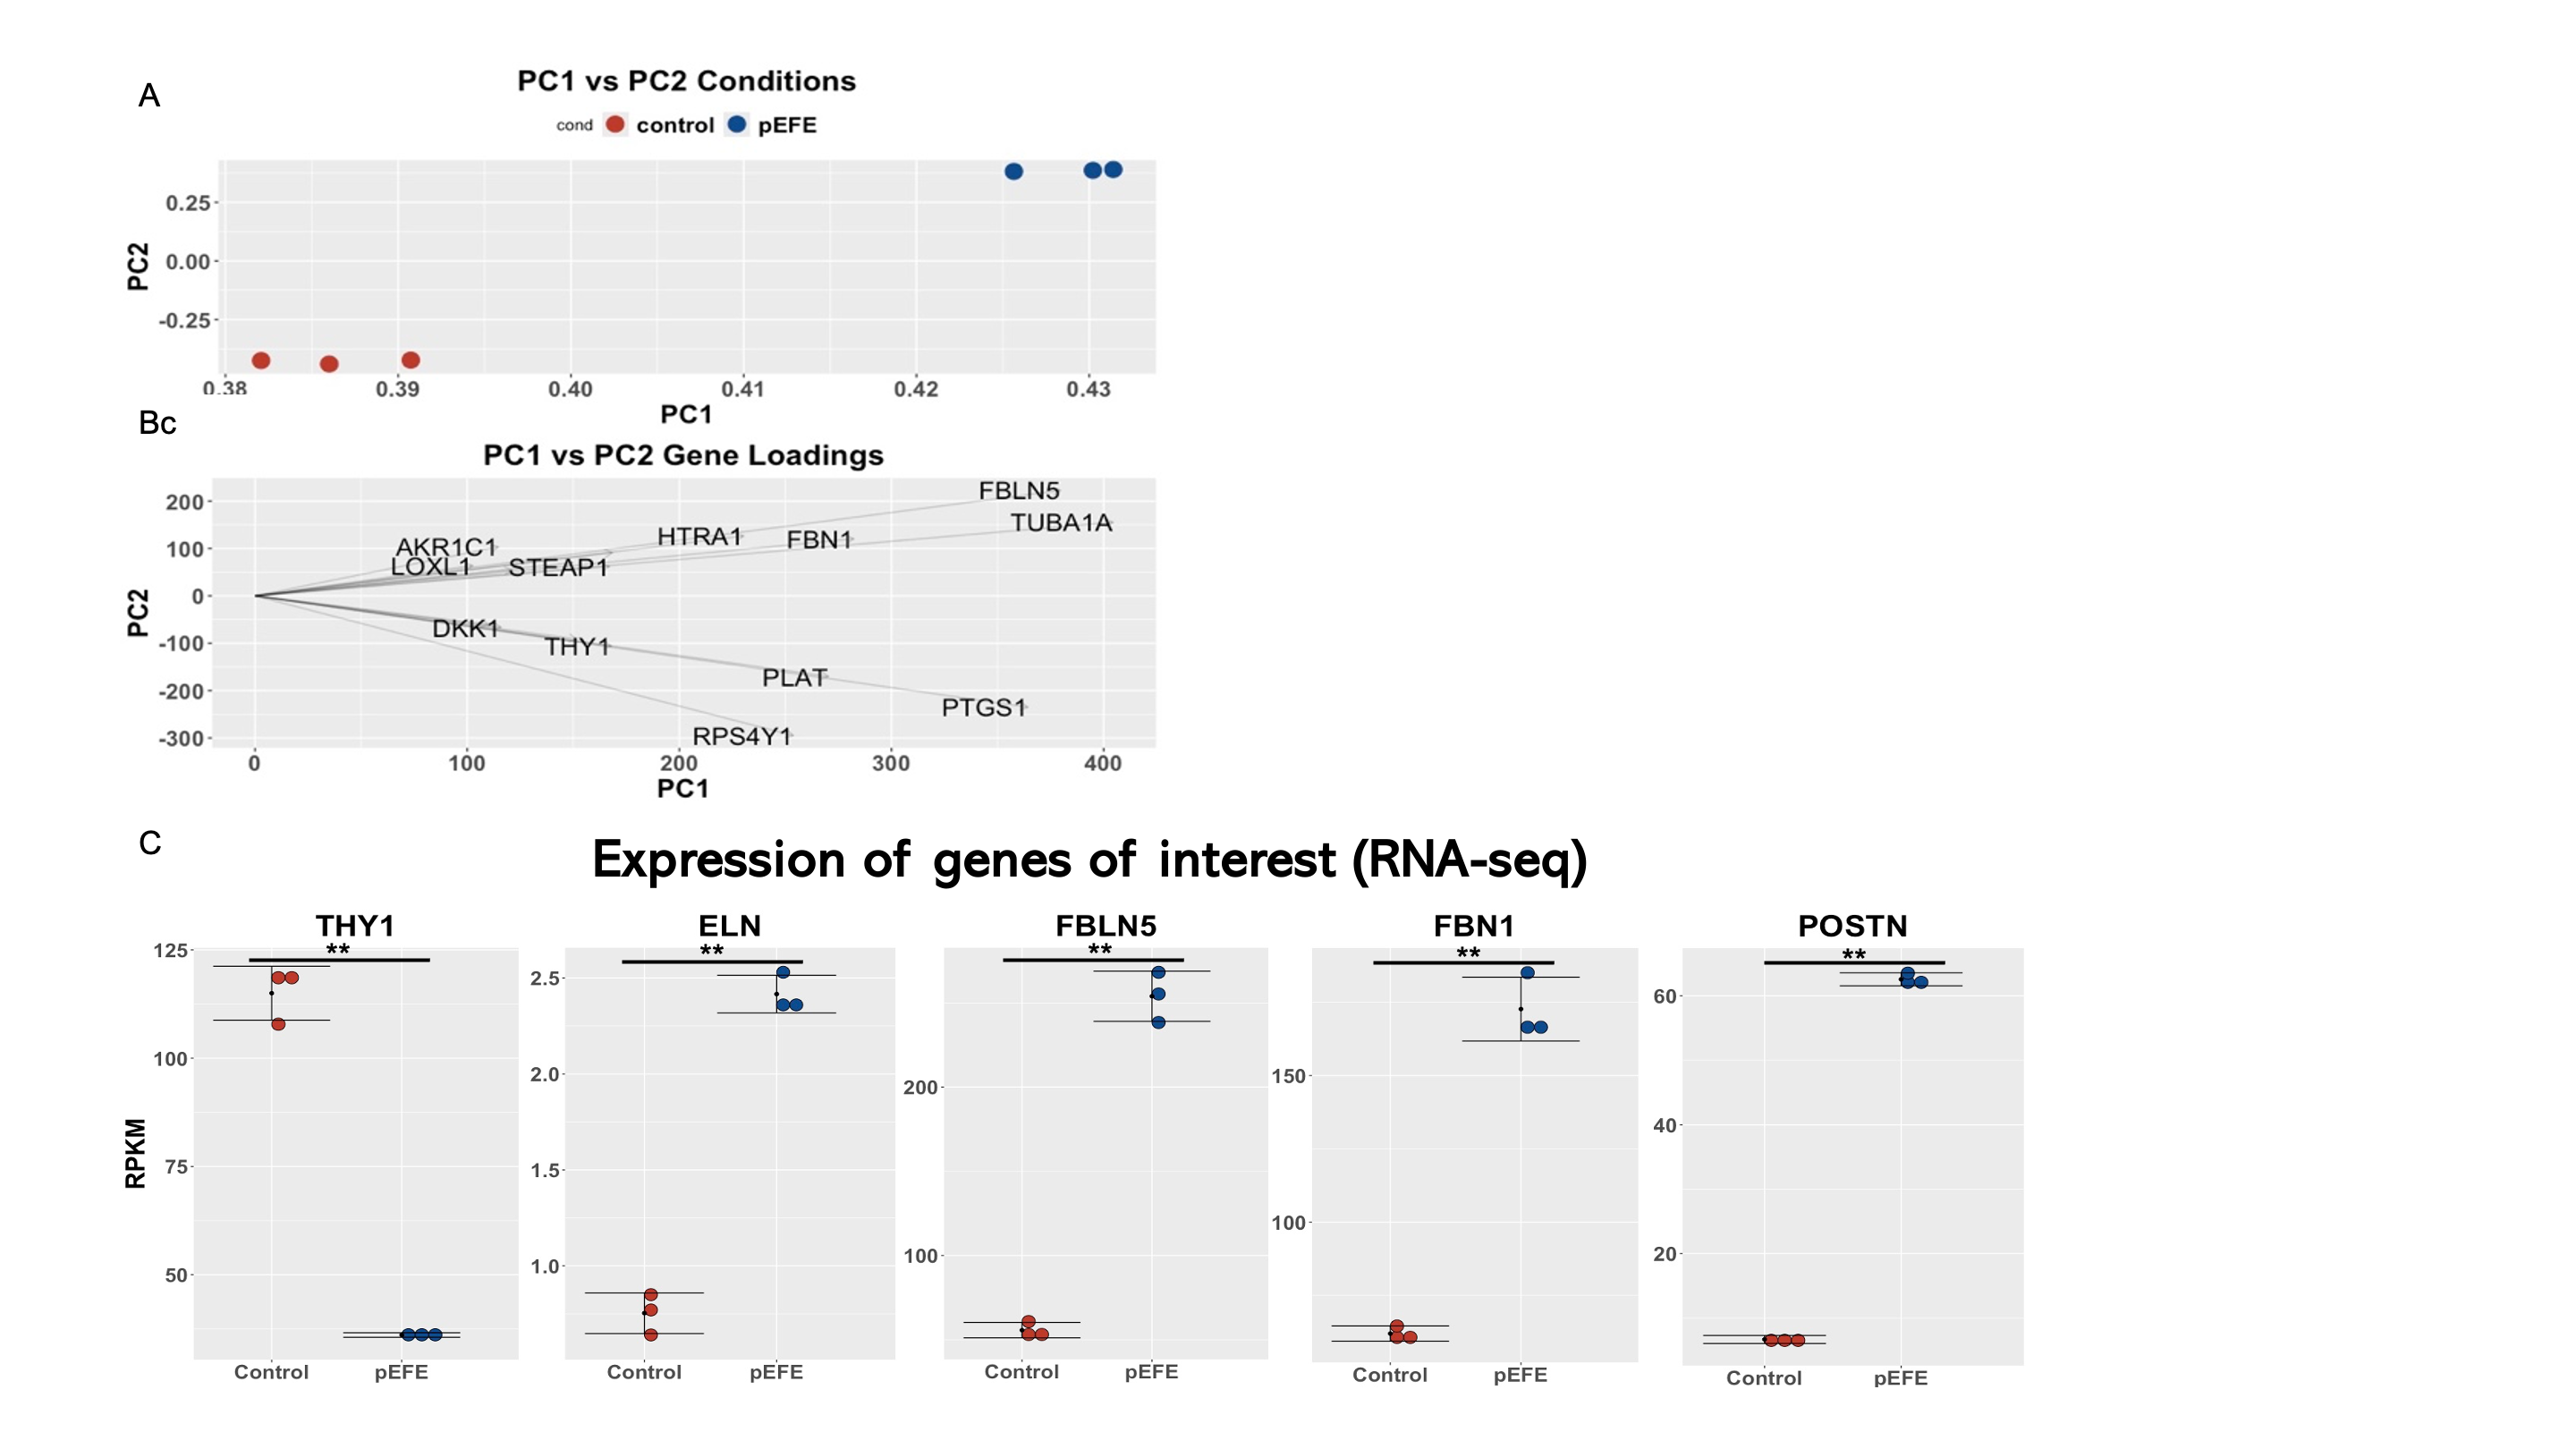 A. Each of the control and pEFE patient samples plotted along the first two principal components (PC). B. Loadings of genes along the first two PCs. Longer lines indicate more influence on the PC. C. Pair-wise comparison (pEFE vs control) of expression values of the differentially genes that drives the variance. Error bars show mean and standard deviation of three technical replicates. PC1, PC2 (principal component 1 and 2, respectively). RPKM: Reads per KB per Million Mapped Reads. ** adjusted p value < 0.01
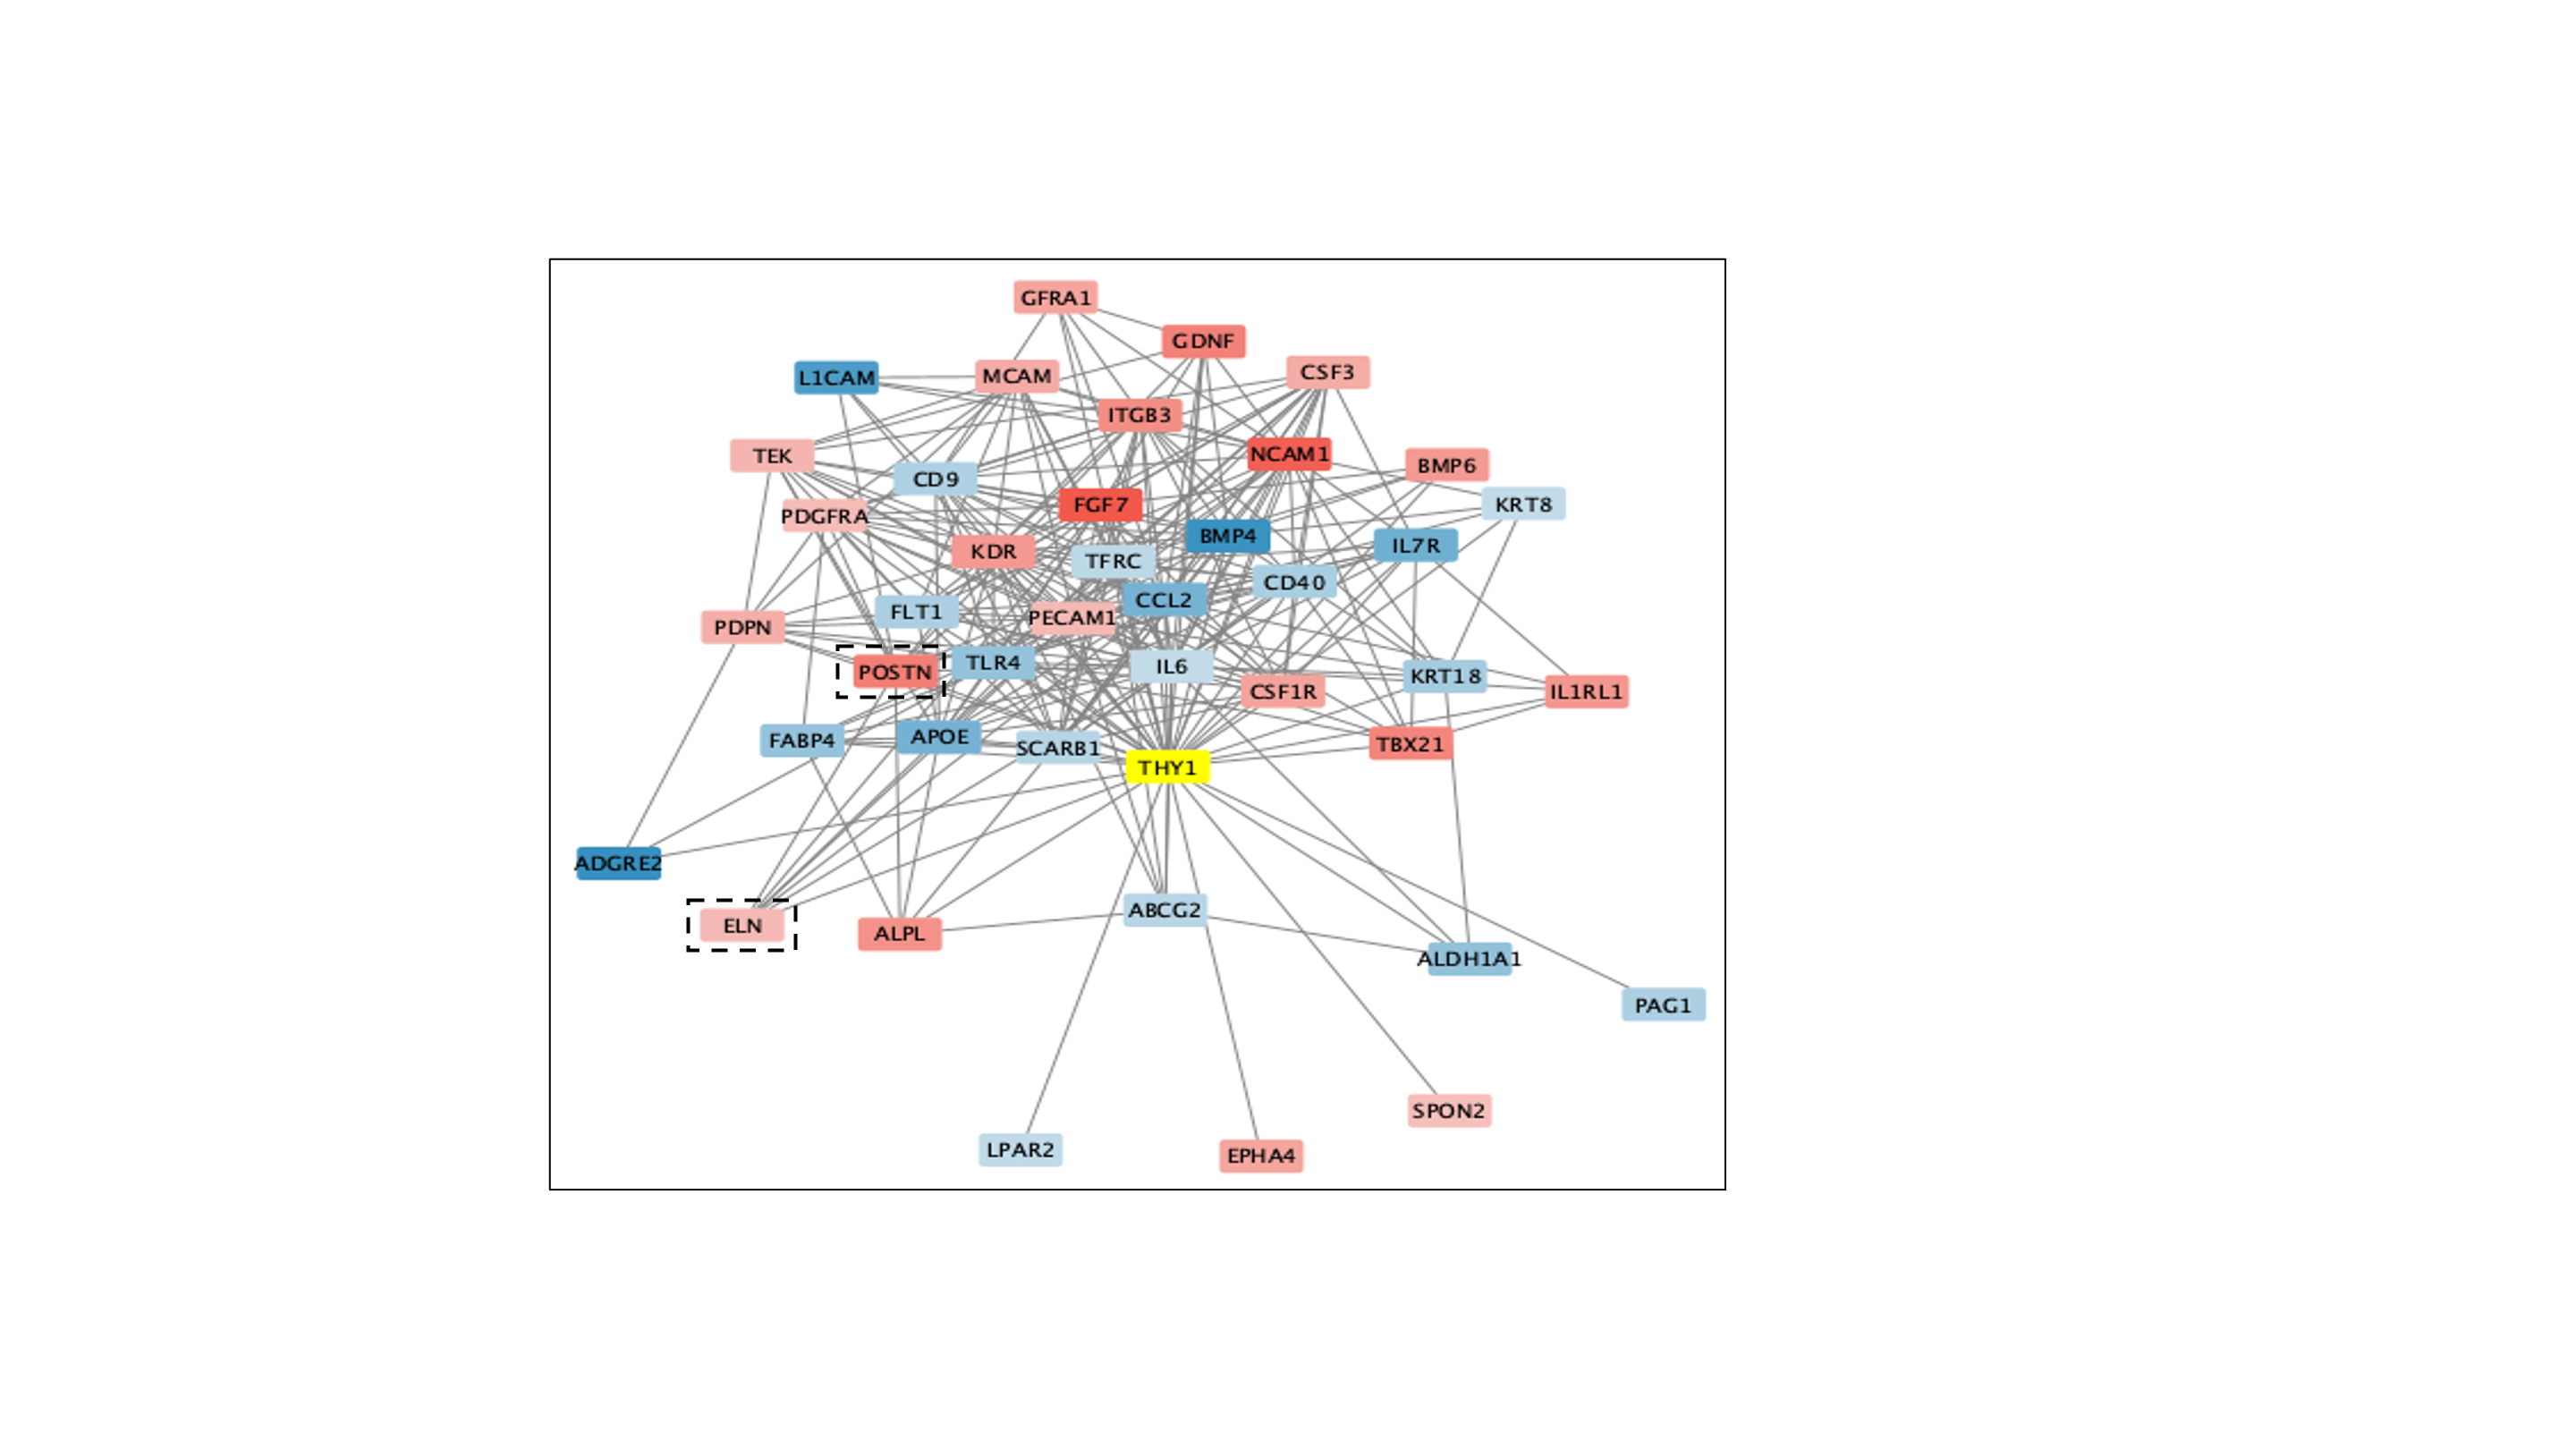 THY-1 and all genes significantly differentially expressed between control and pEFE that have known connections to THY-1 as identified by stringApp. Network visualization generated using Cytoscape. The color of each gene is defined by it’s up- (red) or down- (blue) regulation in the differential expression analysis of control vs pEFE fibroblasts except for THY-1 which is highlighted in yellow. ELN and POSTN are highlighted with a dashed rectangle. A. Each of the control and pEFE patient samples plotted along the first two principal components (PC). B. Loadings of genes along the first two PCs. Longer lines indicate more influence on the PC. C. Pair-wise comparison (pEFE vs control) of expression values of the differentially genes that drives the variance. Error bars show mean and standard deviation of three technical replicates. PC1, PC2 (principal component 1 and 2, respectively). RPKM: Reads per KB per Million Mapped Reads. ** adjusted p value < 0.01THY-1 and all genes significantly differentially expressed between control and pEFE that have known connections to THY-1 as identified by stringApp. Network visualization generated using Cytoscape. The color of each gene is defined by it’s up- (red) or down- (blue) regulation in the differential expression analysis of control vs pEFE fibroblasts except for THY-1 which is highlighted in yellow. ELN and POSTN are highlighted with a dashed rectangle.