Fellow Cleveland Clinic Children's Beachwood, Ohio, United States
Background: Attendance at NICU follow-up clinics is essential for assessing developmental progress and identifying needs for early intervention in high-risk infants. Missed appointments reduce opportunities for timely intervention, potentially impacting developmental outcomes. Baseline attendance rates at our follow-up clinics were suboptimal, highlighting a need for targeted improvements to ensure continuity of care. Objective: This quality improvement (QI) project aimed to increase NICU follow-up clinic attendance rates for the first visit to >90% through a structured intervention bundle and Plan-Do-Study-Act (PDSA) cycles. Design/Methods: We implemented this project at one of the two NICU follow-up clinics. One site (Intervention Site) introduced an intervention bundle, while the other site served as a control without intervention. Our intervention bundle, launched with the first PDSA cycle, included (1) educating parents about the importance of follow-up appointments before discharge, (2) contacting families who missed their initial appointment, and (3) providing rescheduling options to increase access. Baseline first visit attendance rates were collected for both sites before the intervention, and changes in attendance were evaluated after the first PDSA cycle. Results: The baseline first visit attendance rate was around 80% at both sites in 2020 and 2021. After the first PDSA cycle around March 2024, the Intervention Site’s first visit attendance rate gradually increased to 90%, while the control site’s first visit attendance remained below 80%. Parental education, missed-appointment follow-ups, and accessible rescheduling appear effective in increasing first visit attendance at the Intervention Site.
Conclusion(s): Implementation of a simple, structured intervention bundle resulted in improved NICU follow-up clinic attendance for the first visit at the Intervention Site. Continuing PDSA cycles may further help us improve the attendance rate at 1 year and 2-year visits.
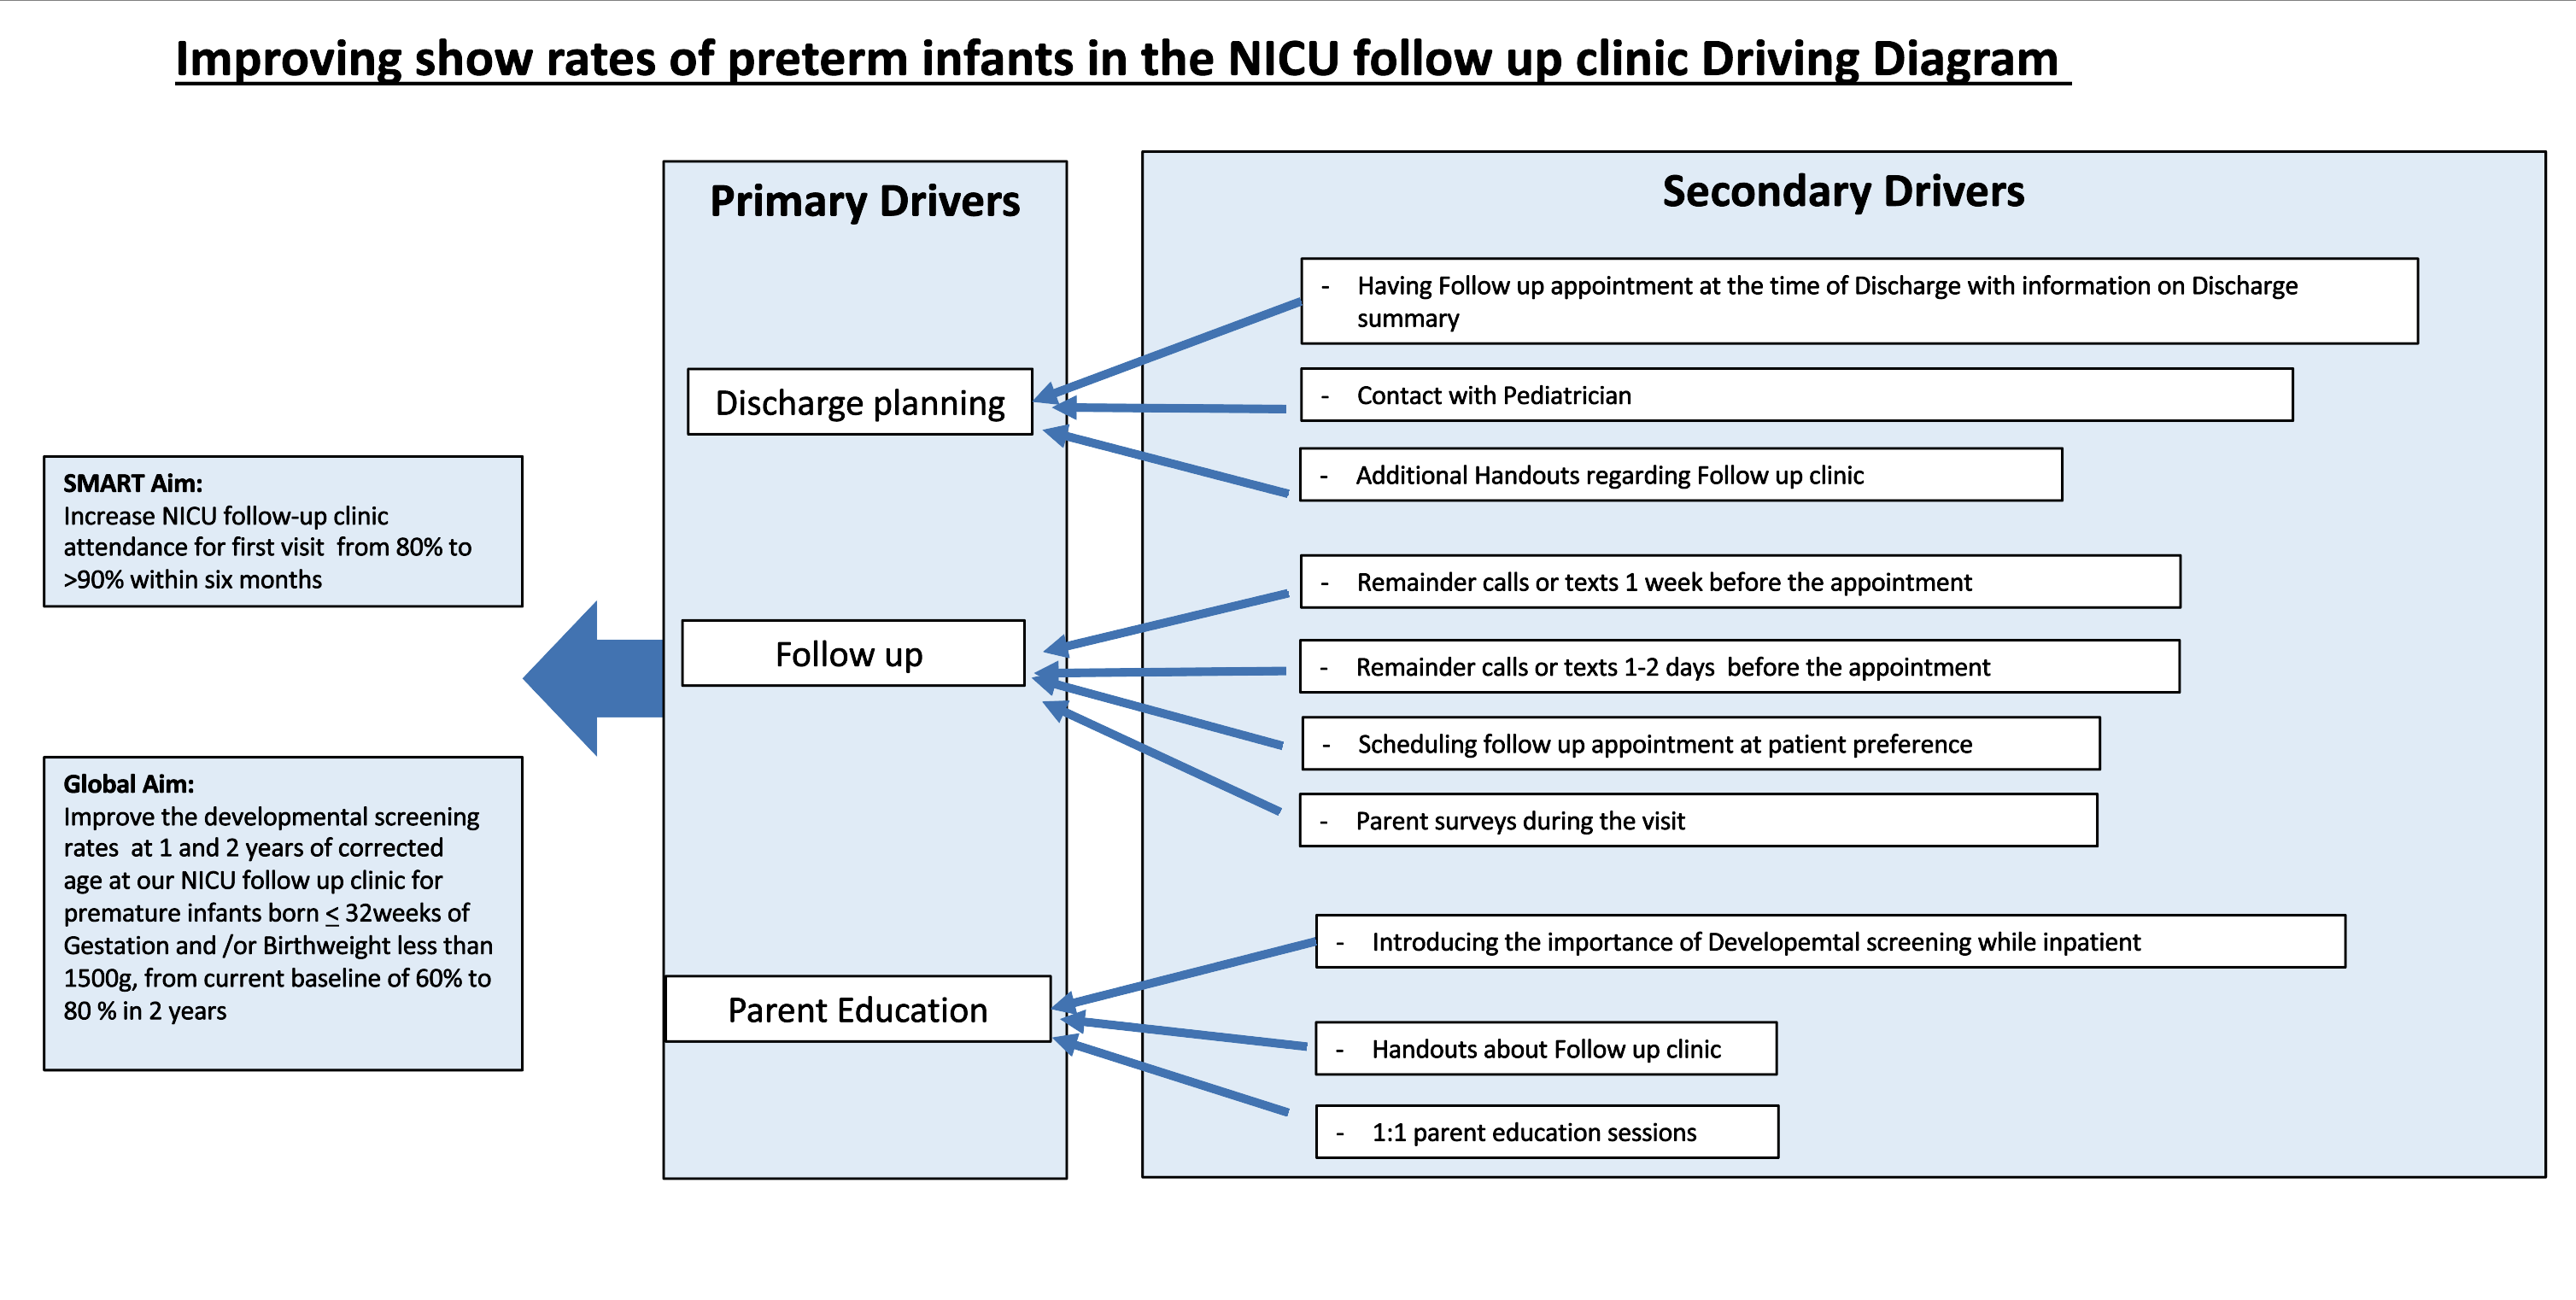
Key Driver Diagram
Trends in Follow up rates for first visit in both the sites

 Credit")
.png)
