473 - Improving Adherence to Developmental and Social Determinants of Health Screening in a Pediatric Primary Care Setting
Saturday, April 26, 2025
2:30pm – 4:45pm HST
Publication Number: 473.5304
Hannah C. Mulvihill, Cohen Children's Medical Center, Manhasset, NY, United States; Chris Tempesta, Cohen Children's Medical Center, Bethpage, NY, United States; Nizmi Ponery, Cohen Children's Medical Center, Manhasset, NY, United States; Nirmala Gupta, Cohen Children's Medical Center, Queens, NY, United States; Maria Kazmi, Cohen Children's Medical Center, North Bellmore, NY, United States; Robert K. Katz, Northwell Heath, New Hyde Park, NY, United States; Allison Driansky, Donald and Barbara Zucker School of Medicine at Hofstra/Northwell, New Hyde park, NY, United States; Toni D.. Foster, Cohen Children's Medical Center, Jamaica, NY, United States; Jack Chen, Northwell Health, New Hyde Park, NY, United States; Sophia Jan, Cohen Children's Medical Center of Northwell Health, New Hyde Park, NY, United States; Caren Steinway, Cohen Children's Medical Center, Queens, NY, United States
Resident Physician Cohen Children's Medical Center Manhasset, New York, United States
Background: Pediatric well visits are opportunities to address holistic child health. While the AAP recommends standardized screening tools, such as the Survey of Wellbeing of Young Children (SWYC), adherence to screening practice remains suboptimal. Objective: To increase adherence to SWYC screening within two academic urban practices from 12.8% to 30% by June 2024 using quality improvement methodology. Design/Methods: A QI project utilizing Plan-Do-Study-Act (PDSA) cycles. Interventions included visual reminders and electronic health record (EHR) re-design. Chart reviews assessed documentation of screening and patient demographics. The primary outcome measure was SWYC documentation. Balancing measures included the Modified Checklist for Autism in Toddlers, Revised (M-CHAT), and Patient Health Questionnaire (PHQ). SWYC completion rates at the intervention site (academic practices) were compared to a control of 40+ community pediatric practices within a large integrated health system. Chart reviews (n=10,502) occurred between June 2019 and July 2024, and the intervention period started August 2023. Results: Of the 10,502 charts reviewed, 906 were from the intervention period. Compared to community practices, patients attending the academic practices were more likely to have Medicaid (57.0% (3000) vs 29.5% (1543)), have a preferred language other than English (5.6% (293) vs 3.0% (153)), more likely to identify as Black (32.0% (1687) vs 8.9% (464)) and more likely to be Hispanic/Latino (15.5% (814) vs 13.5% (708)), while less likely to be White (13.9% (730) vs 51.4% (2691)) (Table 1). Baseline SWYC completion rates at the academic practice were 12.8% compared to 26.4% in the community practices. Following PDSA cycle 1, (November, 2023), the academic practice rate increased to 42.4% compared to 23.7% in the community practices. After PDSA cycle 2, (April, 2024), the rate further increased to 45.2% compared to 33.3% in community practices (Figure 1). MCHAT completion rates did not significantly change across the study period (69.3% pre-intervention compared to 73.0% during the intervention (p=.379)). PHQ completion rates improved during the study period (82.0% pre-intervention compared to 88.6% during intervention (p=.029)).
Conclusion(s): Quality improvement is an effective methodology to improve SWYC completion rates in pediatric primary care academic practice.
Table 1. Characteristics of patient population in academic and community practices
Figure 1-1. Run Chart of SWYC Screenings across a pediatric primary care network 
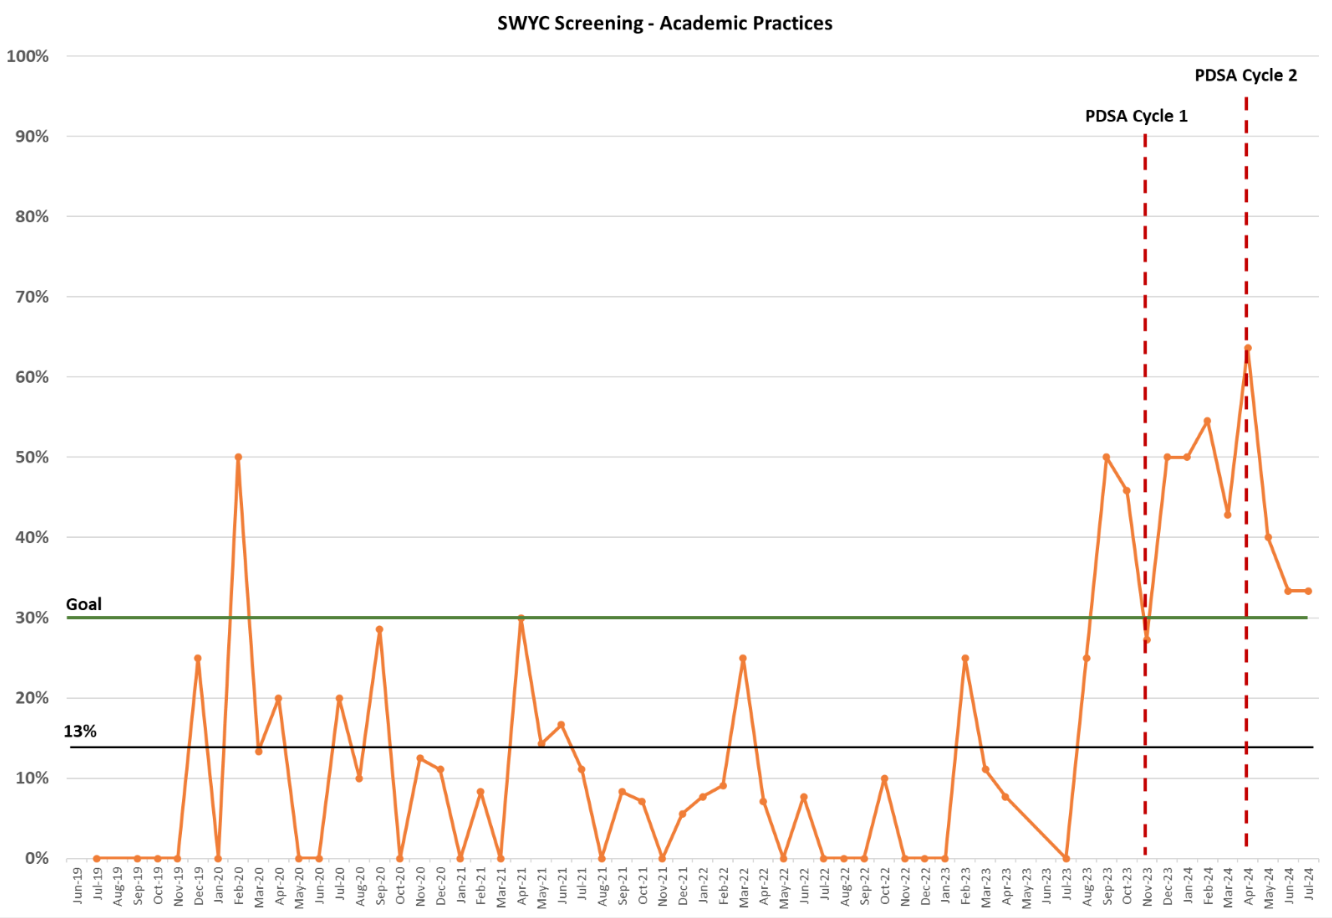
SWYC screening rate depicted over study period for the academic practices, with PDSA cycle 1 (November 2023) and PDSA cycle 2 (April 2024) marked by red dotted line.
Figure 1-2. Run Chart of SWYC Screenings across a pediatric primary care network SWYC screening rate depicted over study period for both academic and community practices. Average screening rate pre-intervention in academic (13%) and community (26%) practices shown, with goal line in green (30%).