675 - Daily variability in macronutrient content of mothers’ milk and donor milk results in under-fortification of protein in over half of infants born <30 weeks
Saturday, April 26, 2025
2:30pm – 4:45pm HST
Publication Number: 675.4180
Danielle E. Ackley, University of Rochester School of Medicine and Dentistry, Webster, NY, United States; Jeffrey Meyers, Golisano Children's Hospital at The University of Rochester Medical Center, Rochester, NY, United States; Carl T. D'Angio, University of Rochester School of Medicine and Dentistry, Rochester, NY, United States; Yuuna C. Miura, University of Rochester School of Medicine and Dentistry, Rochester, NY, United States; Eli Malkovskiy, University of Rochester School of Medicine and Dentistry, Rochester, NY, United States; Bridget Young, University of Rochester School of Medicine and Dentistry, Rochester, NY, United States
Neonatal-Perinatal Fellow University of Rochester School of Medicine and Dentistry Webster, New York, United States
Background: Human milk (HM) is preferred for premature infants; however, fortification is necessary to satisfy their elevated nutrient needs. HM composition differs between mothers and changes over time after birth. Standard feed fortification processes assume static composition of human milk, which puts some infants at risk for under-fortification. Objective: Determine the proportion of infant feed preparations that are under-fortified due to daily macronutrient (fat, true protein, carbohydrate, calories) variability in mother’s HM and/or lot-to-lot variation in donor milk. Design/Methods: Mothers of infants born < 30 weeks provided daily milk samples (MOM; from 24-hour pool) once infants were tolerating 60 ml/kg/day of feeds for up to 28 days. Milk macronutrients were analyzed by mid infrared spectrometry (MIRIS). Individual lots of commercial donor milk were also analyzed. Daily variability was expressed as coefficient of variation (%CV). Macronutrient values were compared to those assumed in the standard feeding protocol. Any value > 10% higher/lower was considered over/under fortified (Table 1). Growth data was collected from the medical chart. Results: 18 mothers participated in this study (gestational age: 26.7 ± 2 wks). Each mother expressed enough volume to cover all of their infants’ feed prescription. The mean MOM fat was 4.36 g/dL (25% higher), carbohydrate was 8.14 g/dL (12% higher), caloric density was 23.62 kcal/oz (18% higher) and protein was 1.26 g/dL (10% lower) than assumed. The mean daily variation for each macronutrient expressed as %CV was 14% for fat, 4% for carbohydrate, 7% for calories, and 14% for protein. The percentage of infants who were over-fortified in fat, carbohydrate, or calorie content > 50% of the study time was 72%, 78%, and 66% respectively. The percentage of infants who were under fortified in protein content > 50% of the time was 56% with 17% of infants having 100% of samples under fortified for protein. The change in infant length z-scores from birth to end of study appeared to be negatively associated with MOM protein content (Figure 1, p=0.09, R2 = 0.17).
For comparison, 20 lots of donor milk were analyzed. Compared to assumed macronutrient content for standard fortification, 100% of lots were over fortified in fat and calories, 50% were over fortified in carbohydrate, and 100% were under fortified in protein.
Conclusion(s): The fat and protein content in MOM varied by > 10%. The mean true protein of MOM and donor milk is lower than assumed values leading to more than half of infants being under fortified in protein content, which may be associated with growth outcomes.
Table 1. Definitions of Fortification Categories Appropriately fortified feeds are defined as base product within 10% of: 20 kcal/oz, 1.4 g/100 ml protein, 3.5 g/100 ml fat, and 7.3 g/100 ml carbohydrate. An infant will be considered under-fortified in one macronutrient if below the expected threshold and over-fortified if the macronutrient is above the expected threshold.
Figure 1. Change in Length Z Scores and Mean Protein Content 
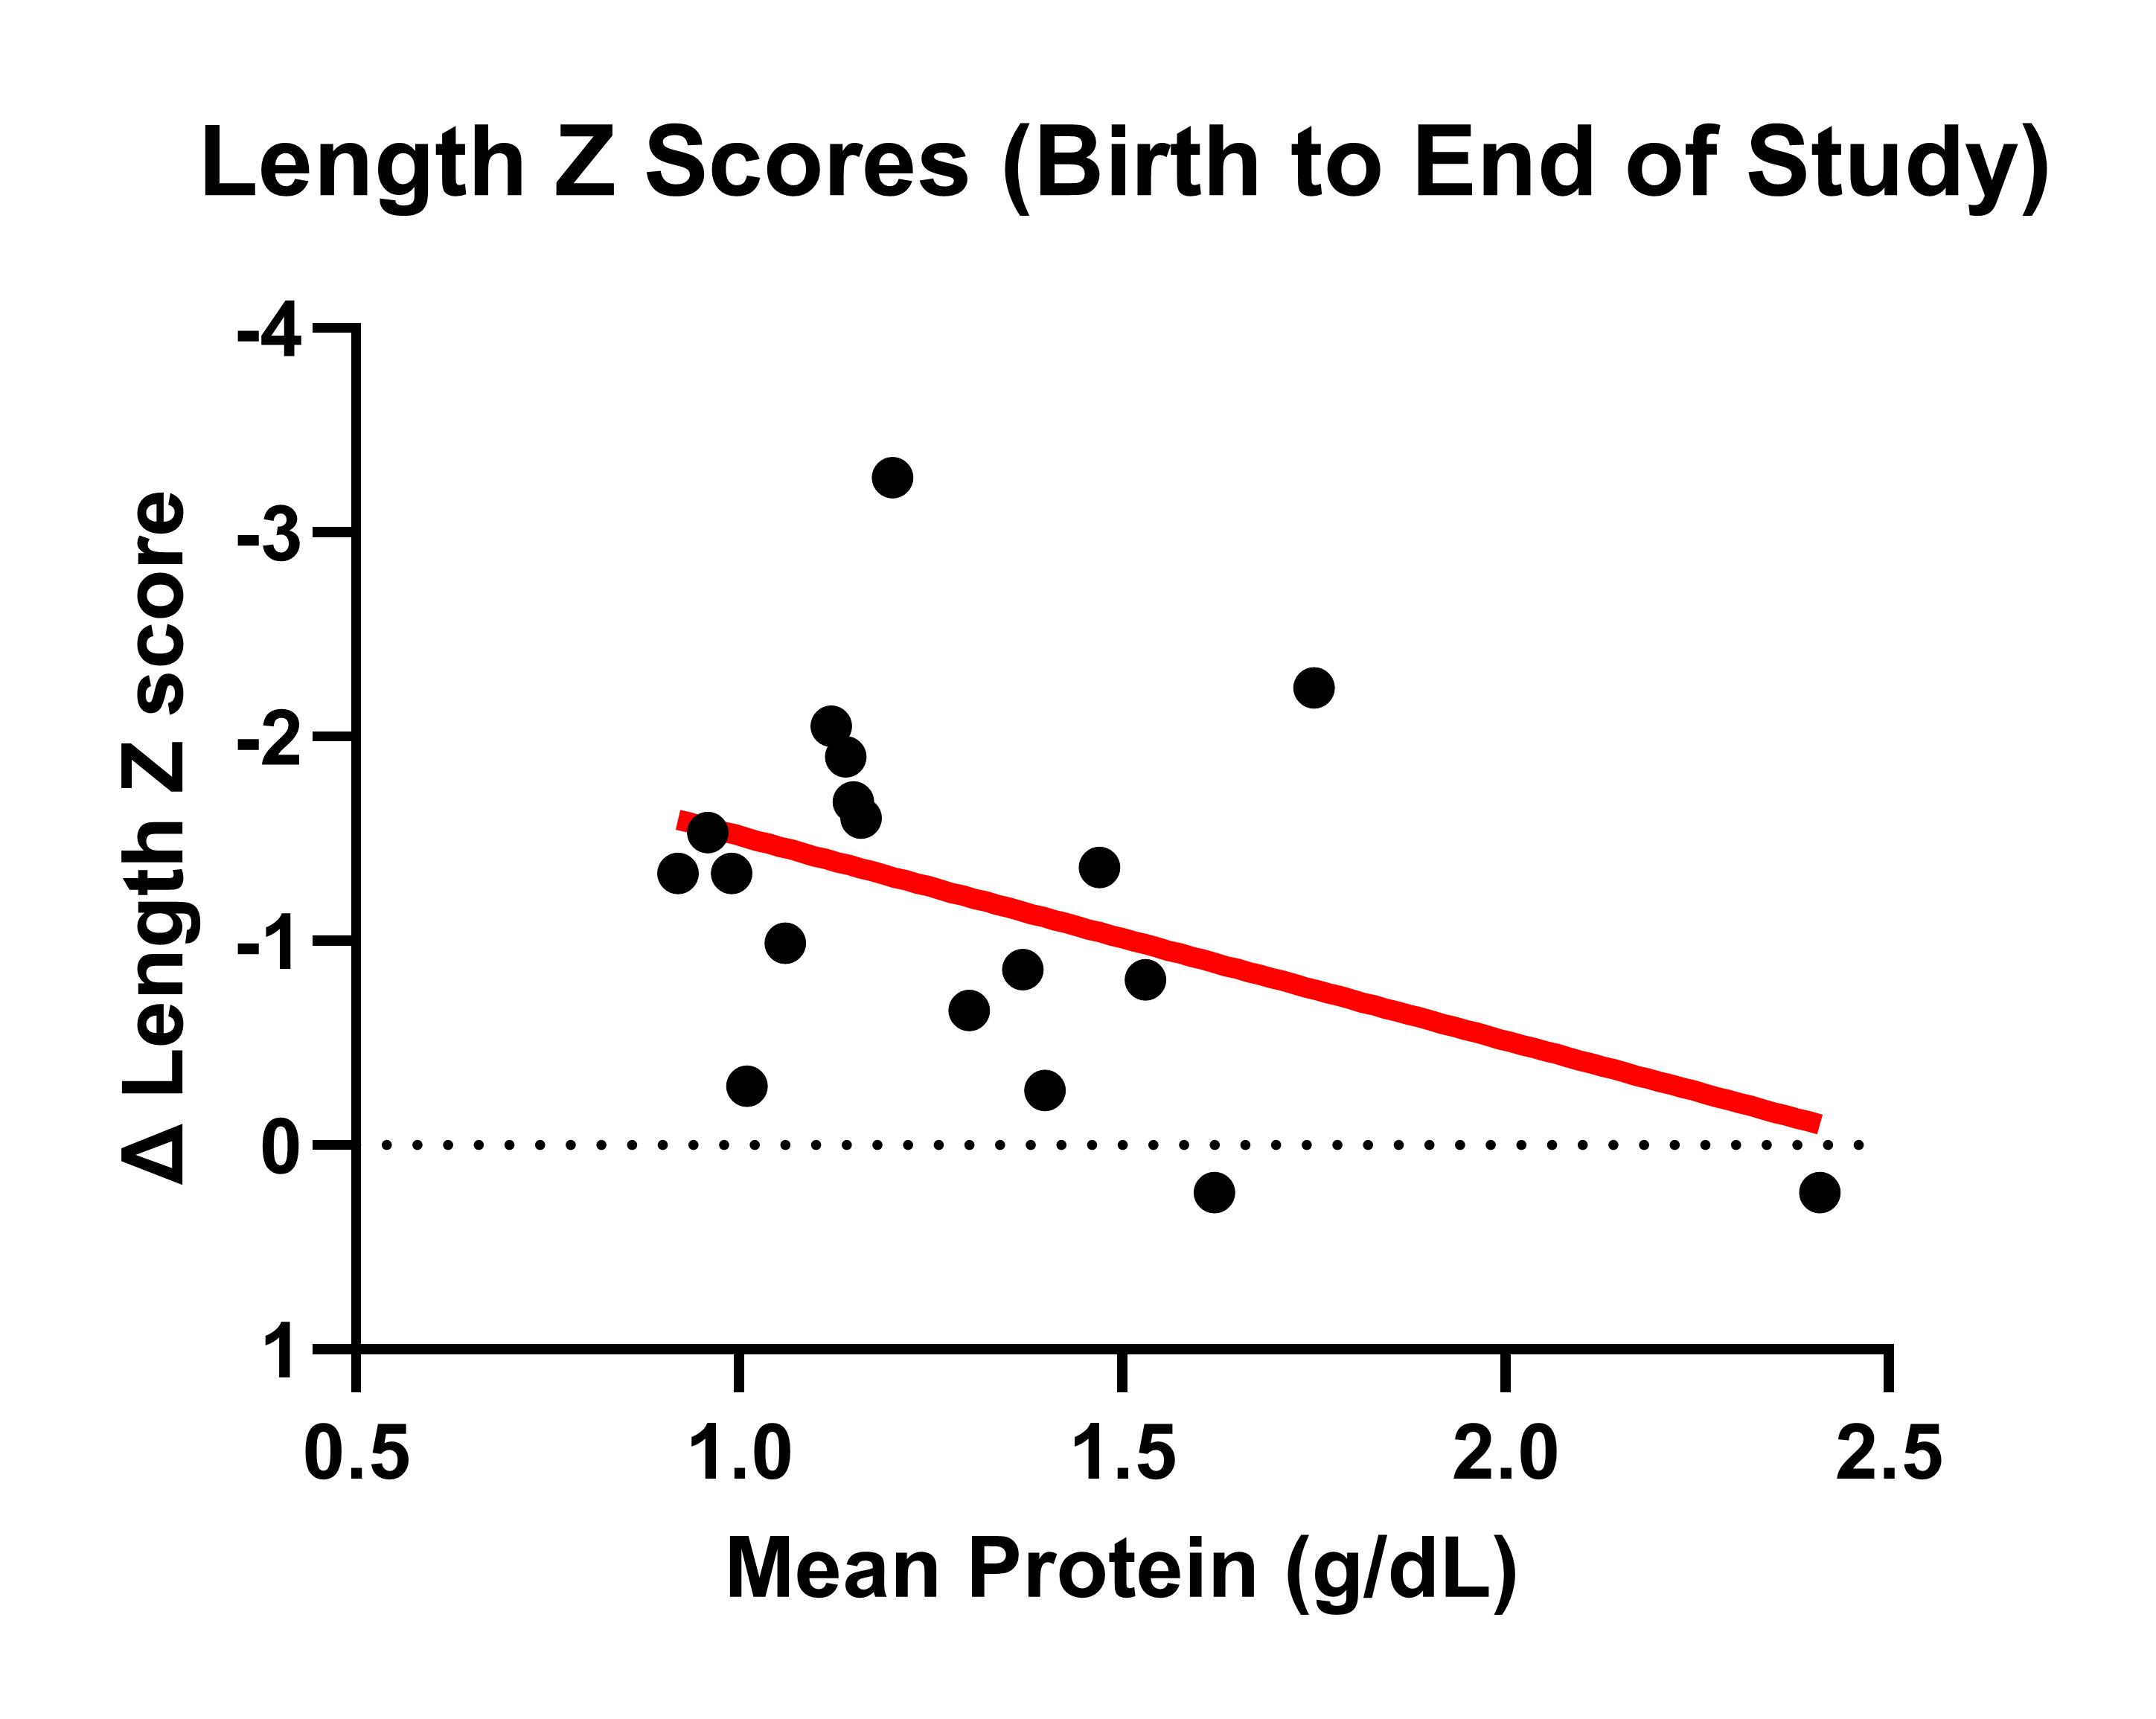
Linear regression comparing mean protein (g/dL) and infant change in length Z-scores from birth to end of study (p= 0.09, R2 = 0.17).