
Health Equity/Social Determinants of Health 6
Session: Health Equity/Social Determinants of Health 6
 photo")
Jean A. Junior, MD MPhil (she/her/hers)
Pediatric Emergency Medicine Attending
Ann & Robert H. Lurie Children's Hospital of Chicago, United States
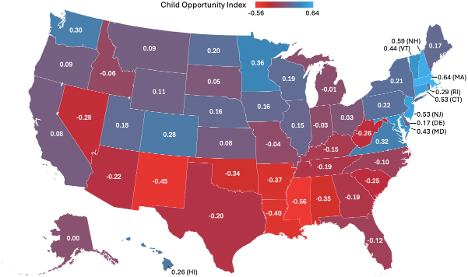 Each z-score is the weighted average of all census tract-years for each state for midpoint years 2010 through 2019. Each census tract-year represents 1 census tract with 5-year averaged COI centered on 1 midpoint year (eg, a census tract with COI data averaged for years 2008-2012 and thus centered on midpoint year 2010).
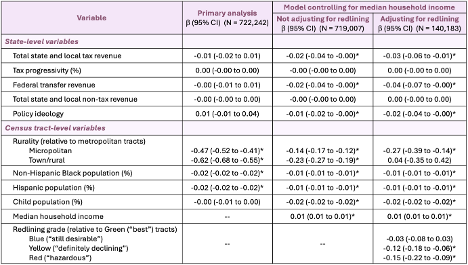 N = Census-tract years. All models include year dummy variables (not shown). All revenue and income variables are in thousands of 2023 US dollars. All revenue variables are per capita. Federal transfer revenue is revenue transferred from the federal government to state governments, which helps compensate for inadequacies in state tax revenues. Non-tax revenue includes fees (eg, state university tuition), fines (eg, traffic violations), and earnings from government investments. Policy ideology is defined with a mean of 0 and positive values representing more liberal ideologies. Labels assigned to redlining grades are those used by the federally funded Home Owners’ Loan Corporation in the 1930s. * p < 0.05.Each z-score is the weighted average of all census tract-years for each state for midpoint years 2010 through 2019. Each census tract-year represents 1 census tract with 5-year averaged COI centered on 1 midpoint year (eg, a census tract with COI data averaged for years 2008-2012 and thus centered on midpoint year 2010).N = Census-tract years. All models include year dummy variables (not shown). All revenue and income variables are in thousands of 2023 US dollars. All revenue variables are per capita. Federal transfer revenue is revenue transferred from the federal government to state governments, which helps compensate for inadequacies in state tax revenues. Non-tax revenue includes fees (eg, state university tuition), fines (eg, traffic violations), and earnings from government investments. Policy ideology is defined with a mean of 0 and positive values representing more liberal ideologies. Labels assigned to redlining grades are those used by the federally funded Home Owners’ Loan Corporation in the 1930s. * p < 0.05.