
Health Equity/Social Determinants of Health 6
Session: Health Equity/Social Determinants of Health 6
.jpg "Joseph C. Cleveland, III, BS (he/him/his) photo")
Joseph C. Cleveland, III, BS (he/him/his)
Medical Student
University of Colorado School of Medicine
Denver, Colorado, United States
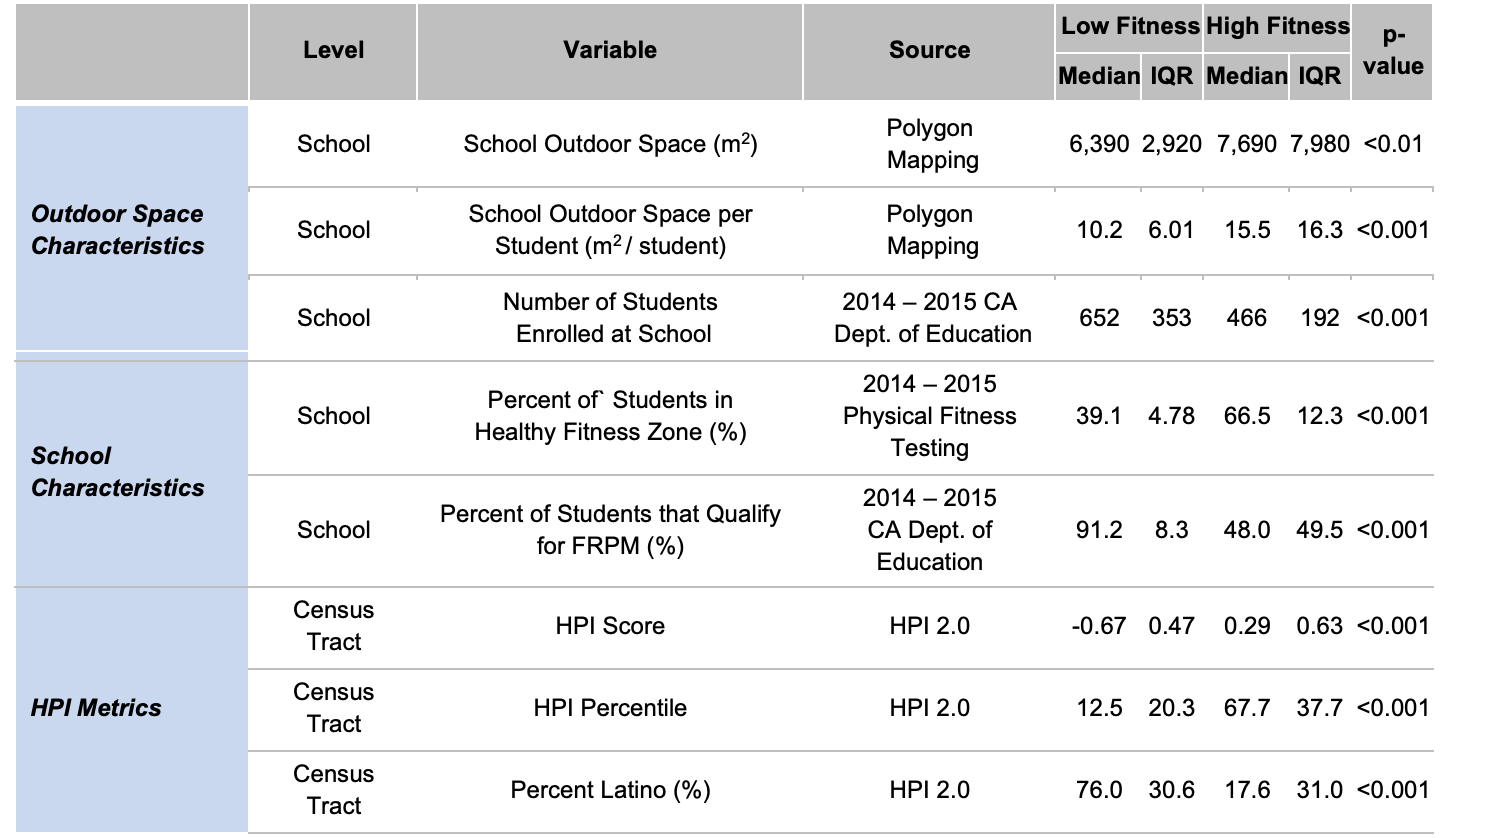 FRPM: Free-or-reduced-price meals; HPI: Healthy Places Index 2.0
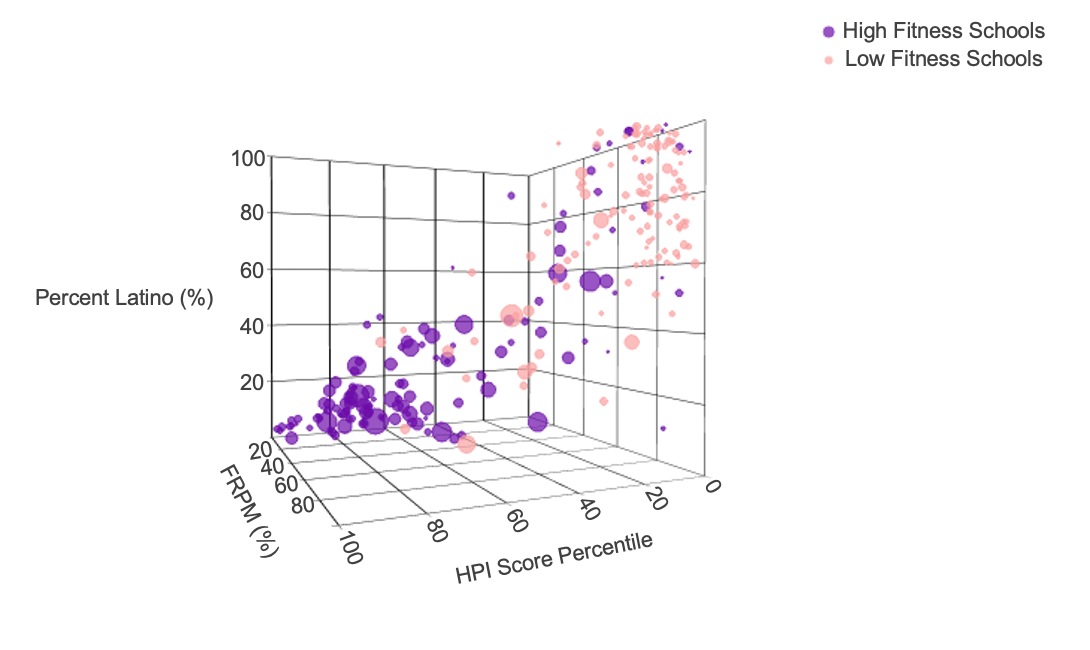 Each dot on this scatterplot represents a school. The diameter of the dots indicates the measured amount of available outdoor space per student at that school. Larger dots indicate schools with a higher level of available outdoor space / student. The x-axis represents Healthy Places Index 2.0 (HPI) Score Percentile with 0 representing the schools in communities with the most adverse SDoH and 100 representing schools in communities with the least adverse SDoH present. The y-axis represents the Percent of Students that Qualify for Free-or-Reduced Price Meals (FRPM) at each school with 0 representing schools in which no students qualify for FRPM and 100 representing schools in which all students qualify for FRPM. The z-axis represents the Percent Latino (%) of census tract in which the school is located, with 0 representing census tracts with 0% of population identifying as Latino and 100 representing census tracts with 100% of population identifying as Latino.
 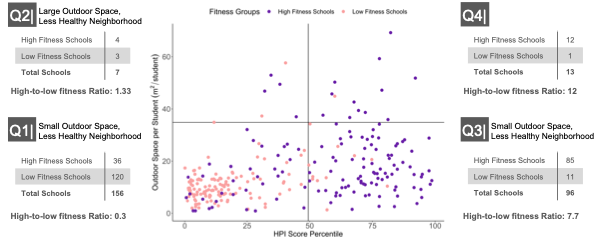 Outdoor Space per Student (m2 / student) is captured on the y-axis. On the x-axis, HPI Score Percentile is captured. Each dot represents a school. Pink dots indicate schools in the Low Fitness Group and purple dots indicate schools in the High Fitness Group. The graph is broken up into four quadrants; from bottom to top and left to right, Q1 indicates schools with low levels of outdoor space / student and low HPI scores, indicating these schools are located in neighborhoods with more adverse SDoH. Q2 indicates schools with high levels of outdoor space / student and low HPI scores. Q3 indicates schools with lower levels of outdoor space and high HPI scores and Q4 indicates schools with high levels of outdoor space and low HPI scores. The number is each quadrant reflects the fraction of high fitness schools to low fitness schools. For example, in Q2, there are 1.33 high fitness schools for each low fitness school. Lower numbers indicate greater amounts of low fitness schools in a quadrant while high numbers indicate greater number of high fitness schools in a quadrant.