Health Equity/Social Determinants of Health 4
Session: Health Equity/Social Determinants of Health 4
693 - Co-creating an Assessment to Improve Belonging for Population Thriving
Sunday, April 27, 2025
8:30am - 10:45am HST
Publication Number: 693.4520
Monique Quinn, Cincinnati Children's Hospital Medical Center, Cincinnati, OH, United States; Carley Riley, Cincinnati Children's Hospital Medical Center, Cincinnati, OH, United States; Cody Saraco-Polner, YMCA of Greater Cincinnati, Mason, OH, United States; Kimberly Cutler, All Children Thrive/ Cincinnati Childrens Hospital, Farmersville, OH, United States

Monique Quinn, MD (she/her/hers)
Clinical Fellow in Critical Care
Cincinnati Children's Hospital Medical Center
Cincinnati, Ohio, United States
Presenting Author(s)
Background: Loneliness is a known social driver of lower life expectancy, while a strong sense of belonging correlates with longevity. Existing research to improve belonging focuses on employment and educational spaces. To broaden that lens, our community-academic partnership utilized participatory methods to discover the community’s understanding of belonging and then develop a set of relevant, scalable measurements. The resultant survey was distributed across the entire membership of the YMCA of Greater Cincinnati (YMCA), providing insights into where high and low belonging exists.
Objective: Using a community-informed survey tool of belonging, stratify levels of belonging across respondents to identify areas for improvement.
Design/Methods: We conducted focus groups with diverse YMCA members to understand how they conceptualize the construct of belonging. Based on those insights as well as extant literature, we created a novel 5-item survey tool. This survey was distributed to all primary account holders across the YMCA via multimodal recruitment. Survey responses were linked to member accounts to provide information on membership activity. Results were co-analyzed by the YMCA and Cincinnati Children’s team, with attention to demographic differences between respondents and nonrespondents and to differences in belonging across demographics that include self-reported race, age, gender, income, YMCA branch, and engagement with YMCA services.
Results: Surveys were distributed to 38,000 primary account holders, with a 13% response rate. When evaluating differences between respondents, nonrespondents, and global membership, we found people who identified as women were over-represented in our results, and those who were 24 years or younger were under-represented. Survey respondents had a higher level of engagement with YMCA services as compared to nonrespondents. When evaluating levels of belonging for respondents, correlation existed between high belonging and frequent YMCA service engagement, but not tenure of membership. Additional insights highlight that primary YMCA branch, income, and age were related to levels of belonging (see Tables).
Conclusion(s): Results indicate that variables associated with physical environment (YMCA site), stage in life (age), and life stressors (income) have potential to impede or strengthen a person’s sense of belonging. Next steps include community-informed site and programmatic changes to improve belonging in low-belonging populations, as well as dedicated outreach to nonrespondent groups to better understand their sense of belonging at the YMCA.
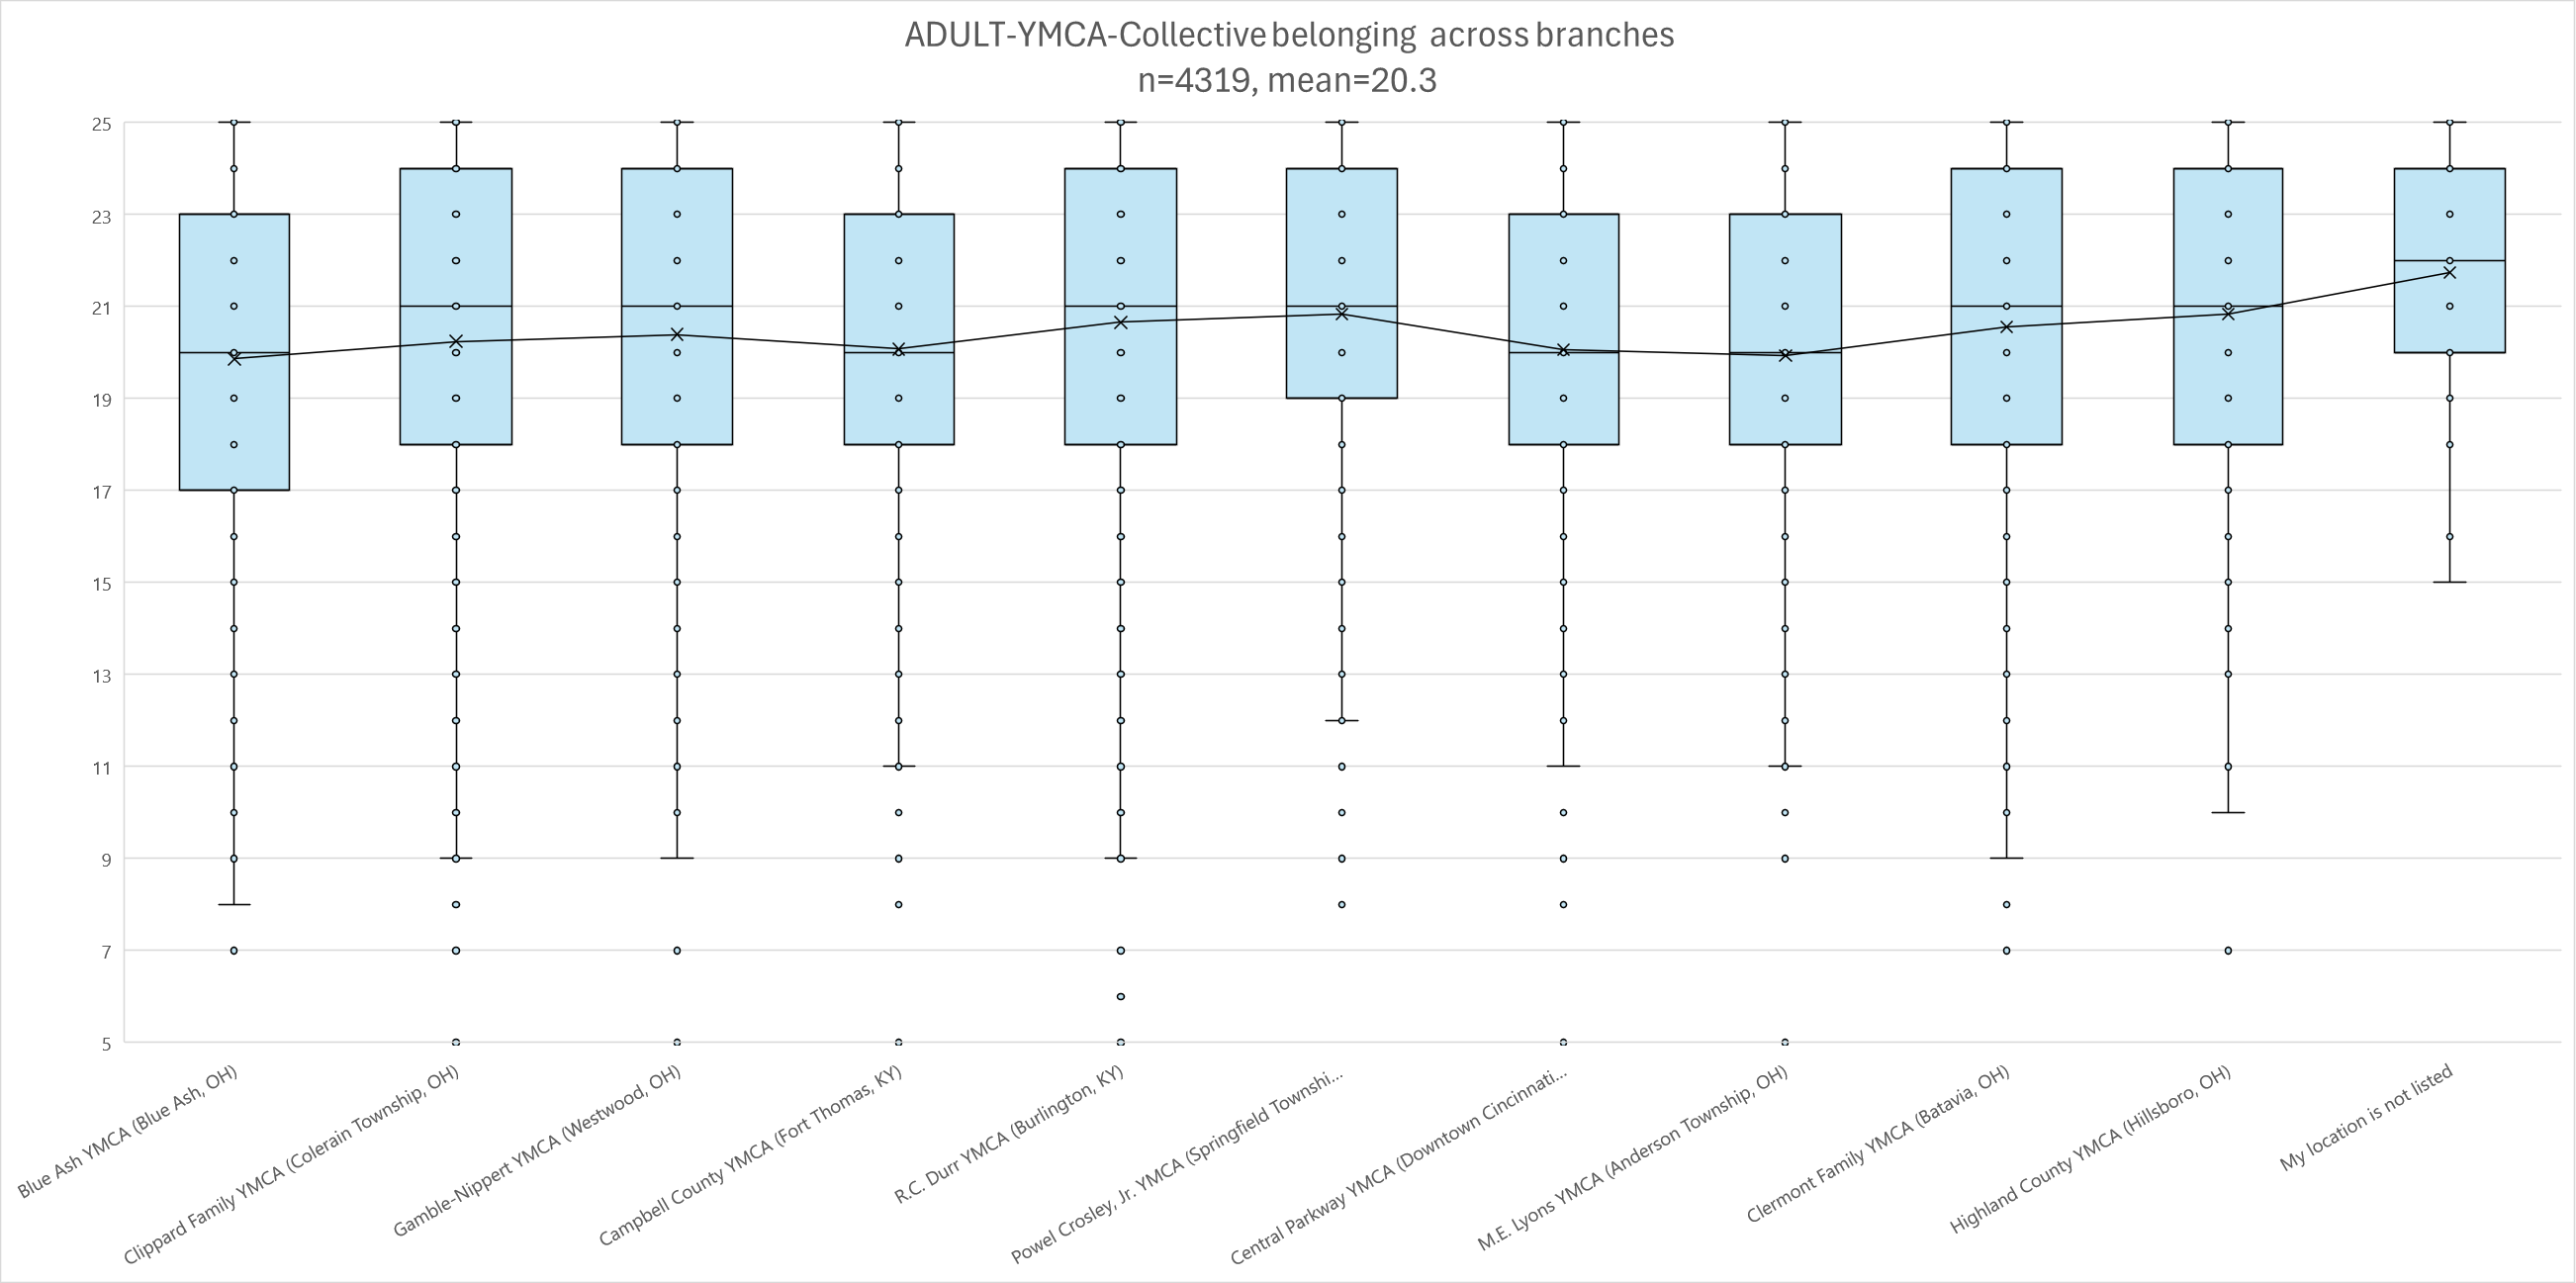
Collective Belonging by YMCA Branch
 This box and whisker plot demonstrates collective belonging (sum of all five belonging questions) based on self-identified YMCA home branch. The box demonstrates the interquartile range, with the line above/below demonstrating the minimum and maximum responses. The line inside the box is the median response, with the x demonstrating the average.
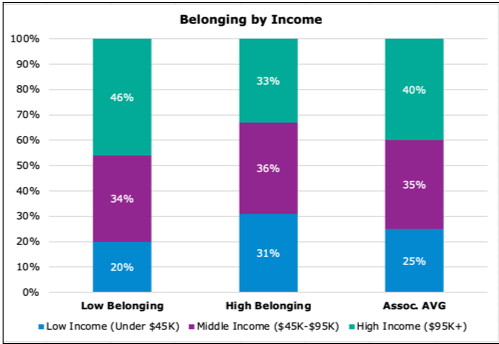
 Belonging Level by Income
 This graph depicts variations in belonging by income level. Low belonging is defined as responding to belonging questions with a score of 3. The association average bar demonstrates income breakdown across the YMCA of Greater Cincinnati for comparison.
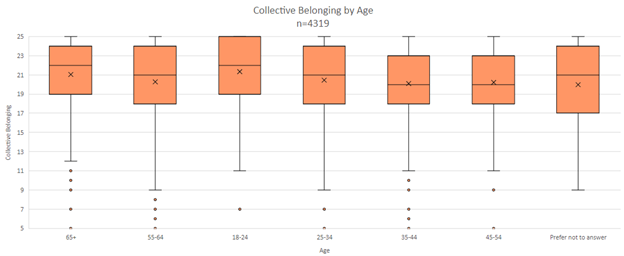
 Collective Belonging by Age
 This box and whisker plot demonstrates collective belonging (sum of all five belonging questions) based on self-identified age. The box demonstrates the interquartile range, with the line above/below demonstrating the minimum and maximum responses. The line inside the box is the median response, with the x demonstrating the average.
