Neonatal Fetal Nutrition & Metabolism 4
Session: Neonatal Fetal Nutrition & Metabolism 4
647 - Neonatal Malnutrition Diagnoses Align Differently With Body Composition Outcomes
Monday, April 28, 2025
7:00am - 9:15am HST
Publication Number: 647.5606
Louise P. Cunha, fede, Salvador, Bahia, Brazil; Kera McNelis, Emory University School of Medicine, Atlanta, GA, United States; Jacqueline Wessel, Cincinnati Children's Hospital Medical Center, Loveland, OH, United States; Stephanie Merlino Barr, MetroHealth Medical Center, Cleveland, OH, United States; Chunyan Liu, Cincinnati Children's Hospital, Cincinnati, OH, United States; Shelley Ehrlich, Cincinnati Children's Hospital Medical Center, Cincinnati, OH, United States; Jae H. Kim, Cincinnati Children's Hospital Medical Center, Cincinnati, OH, United States; Ting Ting Fu, Cincinnati Children's Hospital Medical Center, Cincinnati, OH, United States

Ting Ting Fu, MD
Associate Professor of Pediatrics
Cincinnati Children's Hospital Medical Center
Cincinnati, Ohio, United States
Presenting Author(s)
Background: Premature birth poses significant nutritional risk, requiring comprehensive assessment. This may include the Academy of Nutrition and Dietetics’ neonatal malnutrition criteria, but malnutrition diagnoses may vary depending on the chosen growth chart. Several preterm infant growth charts exist, with differing consensus on their use.
Objective: To evaluate discrepancies in malnutrition diagnoses between three widely utilized growth charts (INTERGROWTH (IG), Fenton, and Olsen) and compare with body composition outcomes.
Design/Methods: This was a retrospective cohort of 258 preterm infants (born < 37 weeks) admitted to 4 neonatal intensive care units from 2012-2023 who had air displacement plethysmography completed after 14 days of age. Main outcomes were IG, Fenton, and Olsen weight Z-scores; malnutrition diagnosis per weight Z-score decline for each growth chart (no malnutrition < 0.8, mild 0.8-1.2, moderate 1.2-2, severe >2); Norris Z-scores/percentiles for fat mass (FM), fat-free mass (FFM), and body fat percentage. Body composition classification (low/adequate/high) was defined as < 10th, 10th-90th, and >90th percentile. We performed linear regression models to compare Z-score relationships; Kruskal-Wallis for Z-scores between groups; Fisher's exact for diagnoses proportions between groups; Kappa coefficients and Bowker's test of symmetry for diagnoses agreement; receiving operating characteristic curves for prediction of body composition categorization. Adjusted models included size-for-gestational-age.
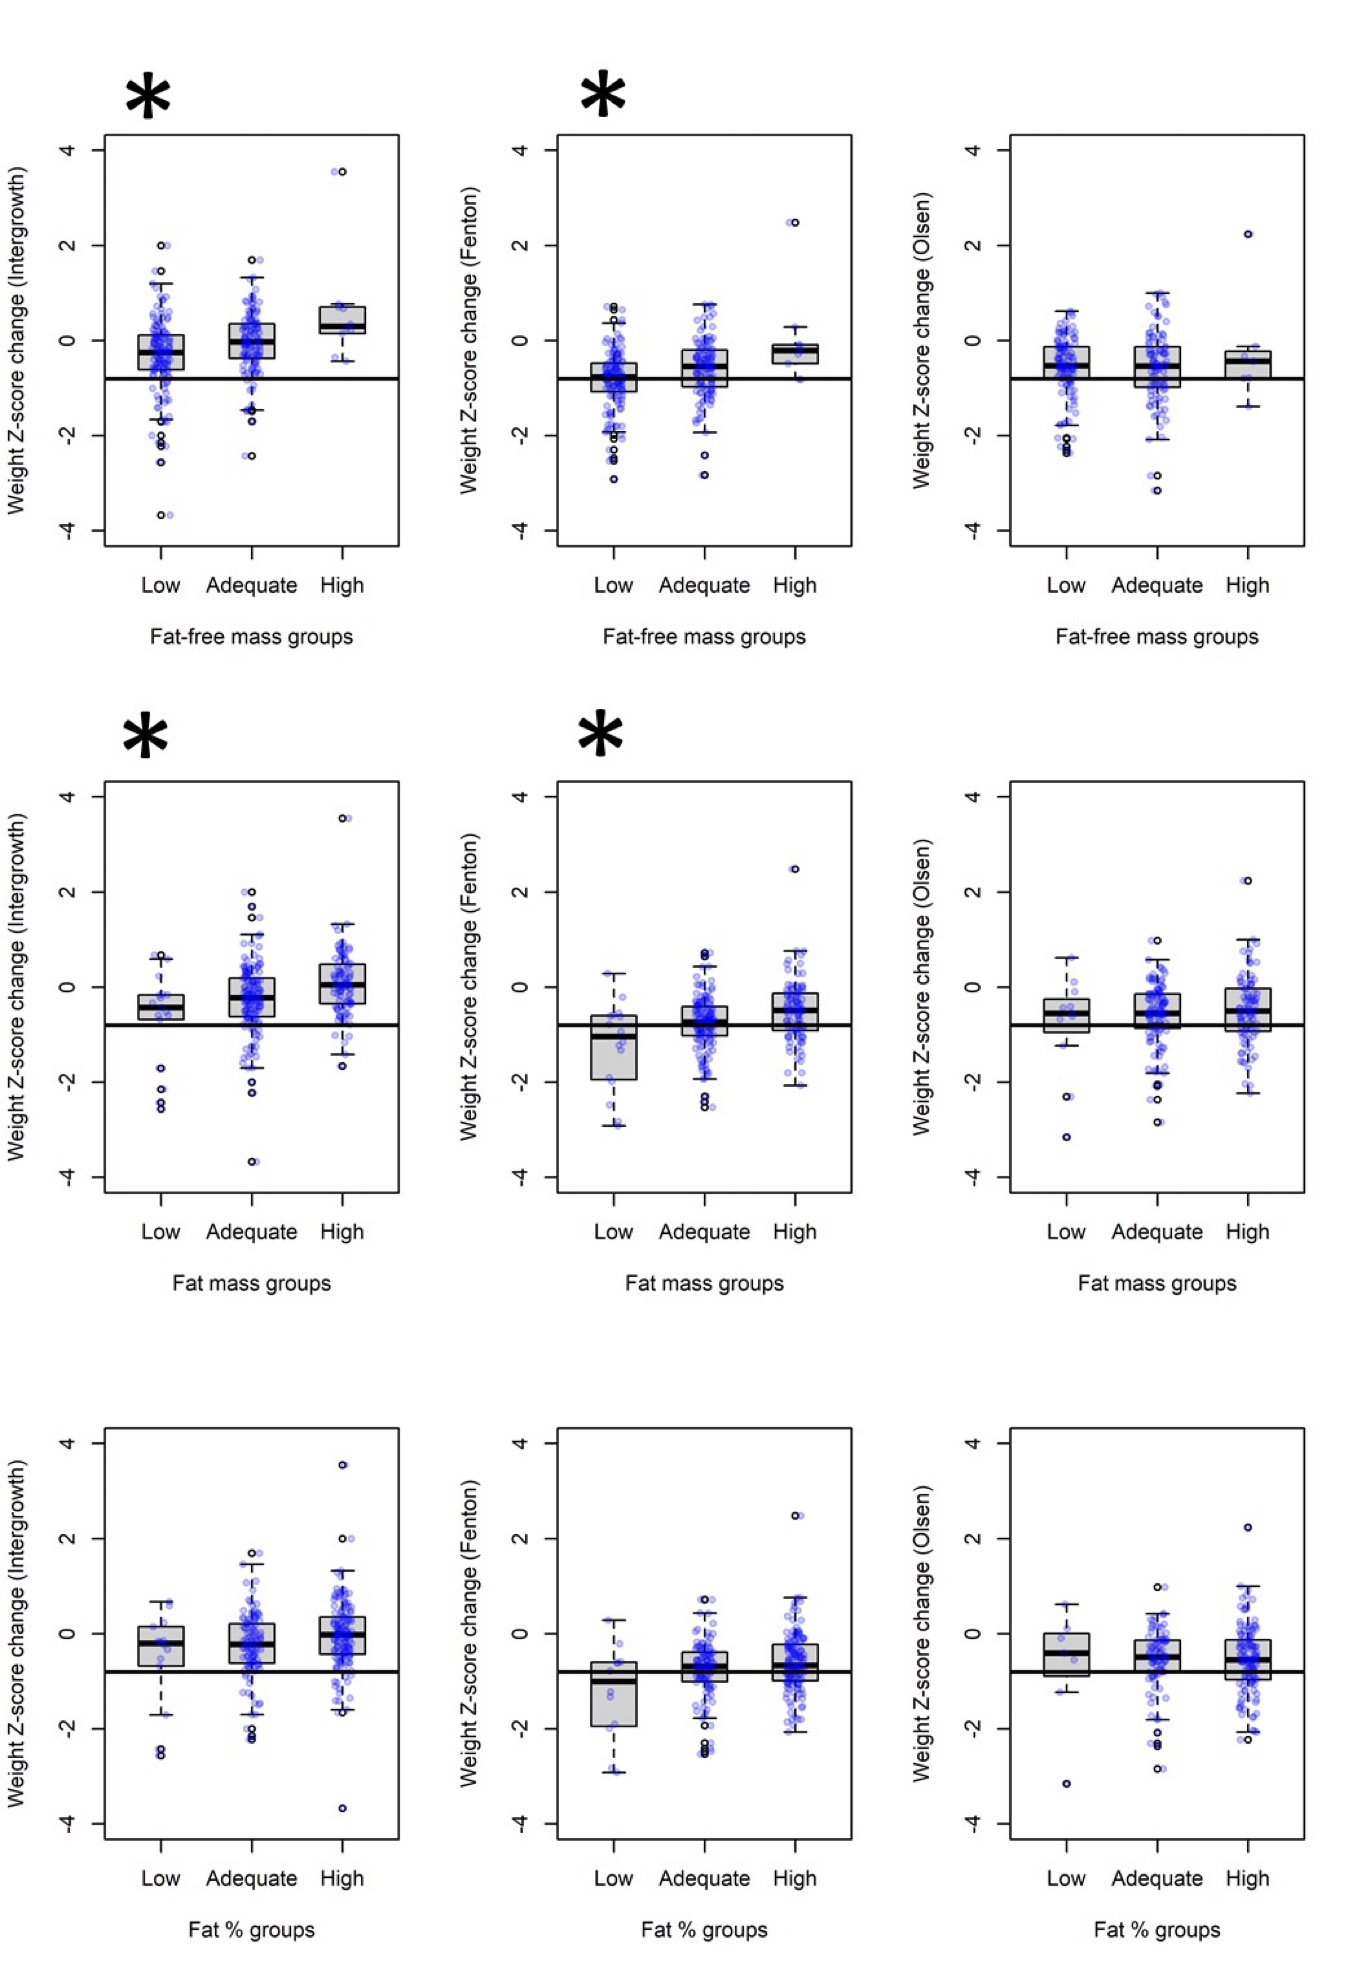
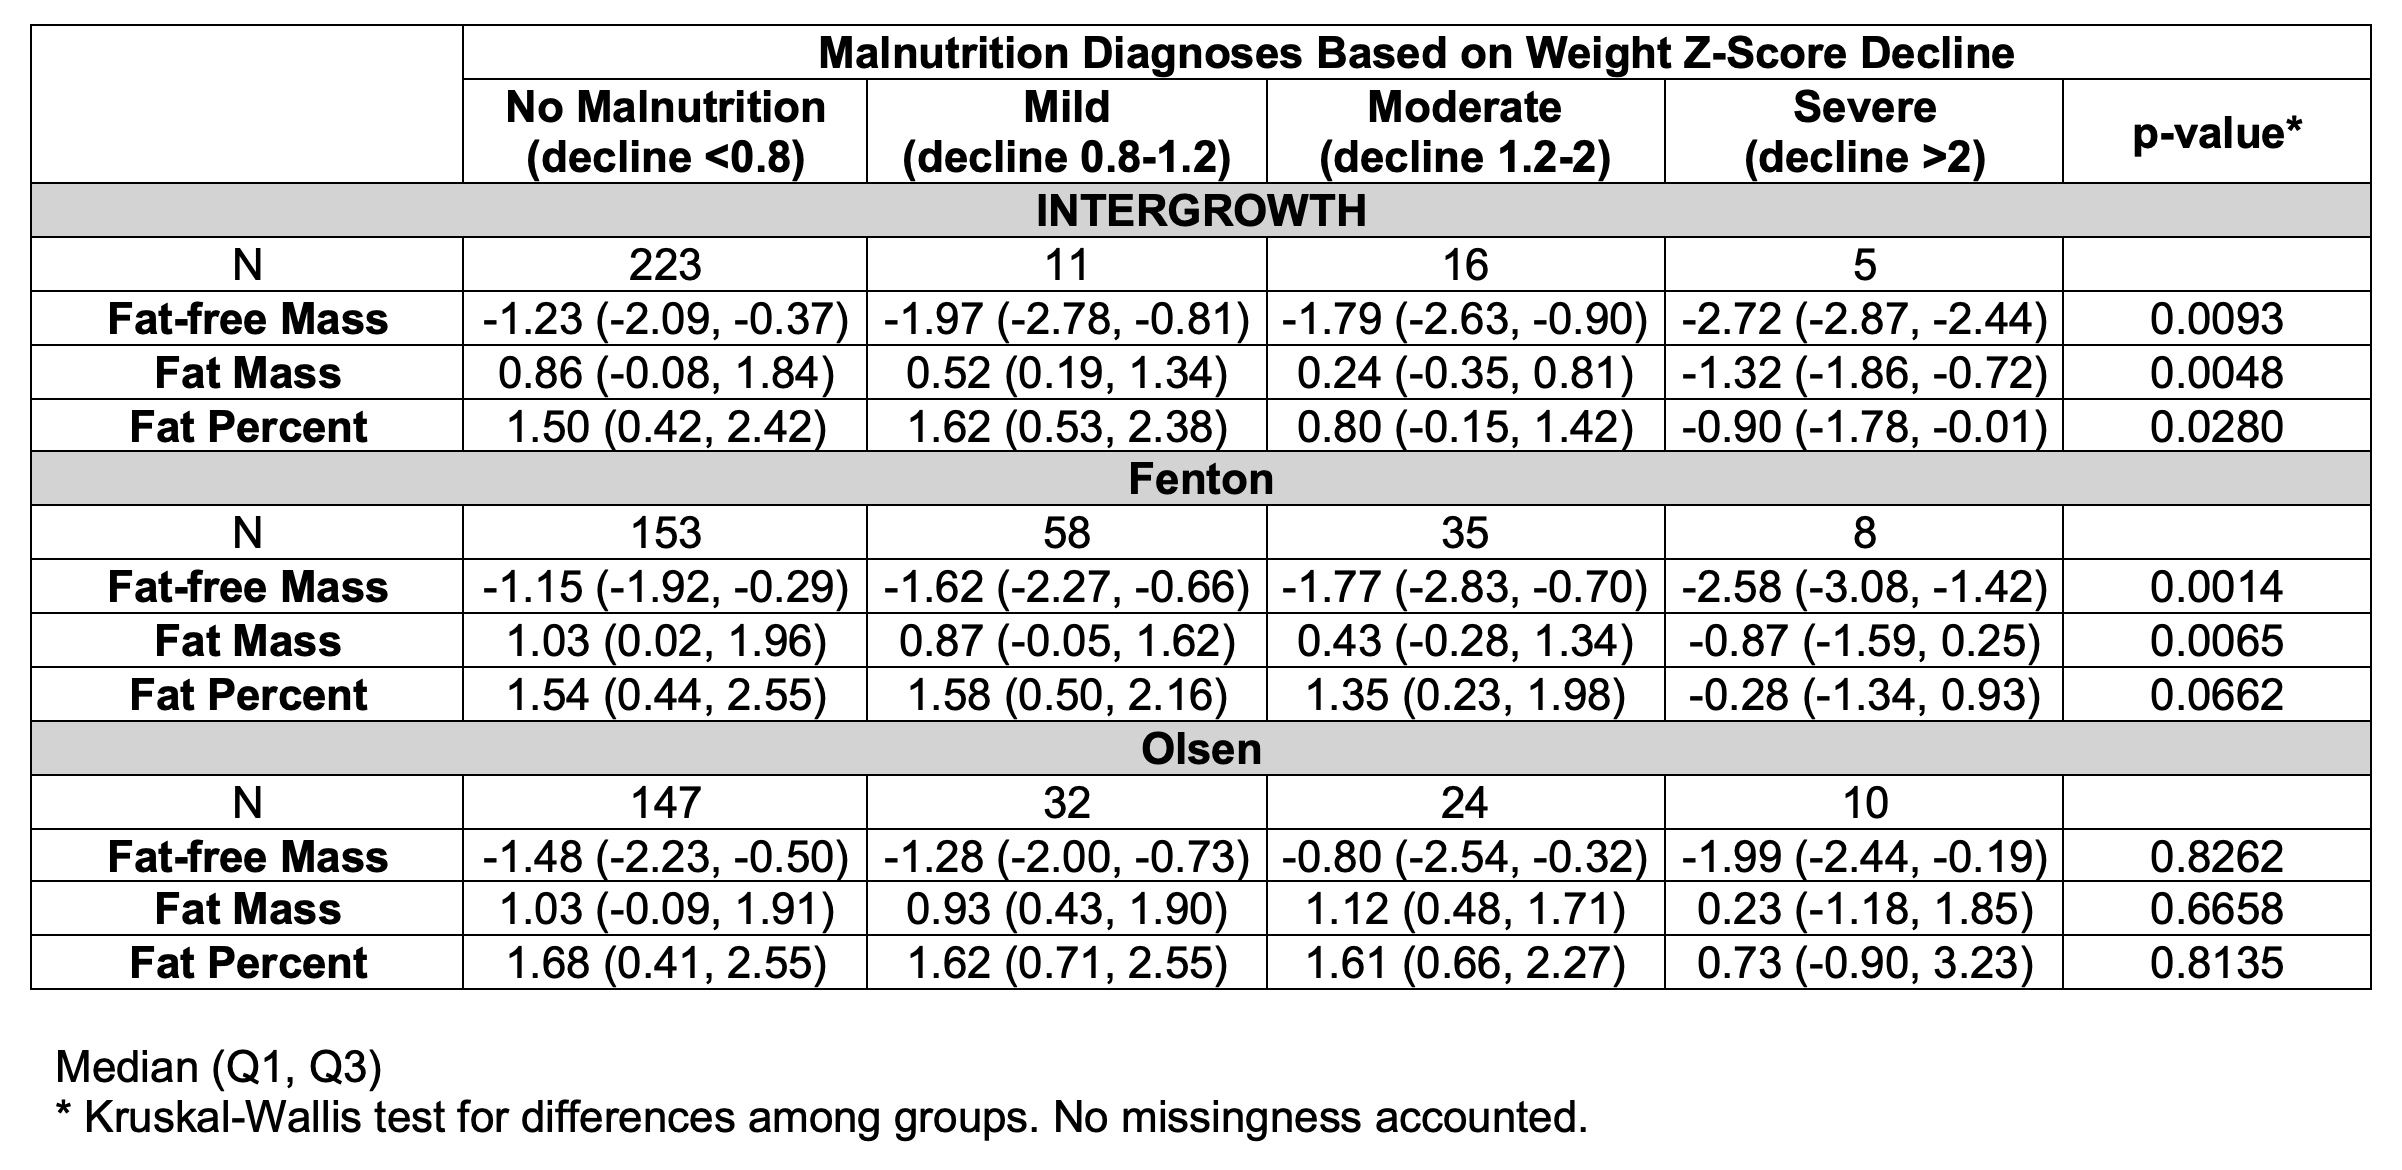
Results: 112 infants (43%) were male. Median (IQR) gestational age was 29.9 (27.9-32), birthweight 1270 g (1020-1470). Differences in malnutrition classification were noted between growth charts (κ=0.29-0.56). IG identified fewer malnutrition cases (p < 0.0001). Weight Z-score changes correlated weakly with body composition Z-scores; adjusting for size-for-gestational-age improved model fit (Figure 1). Fenton classified more malnutrition in infants with low FFM (46.1% vs. 16.4%, p< 0.0001), while IG classified more non-malnourished cases in infants with high FM (94.8% vs. 69%, p< 0.0001) (Figure 2). FFM and FM Z-scores declined as severity of malnutrition diagnoses increased with IG and Fenton (Table 1). Weight Z-score changes had suboptimal predictive performance for low FFM or high FM but improved after adjusting for size-for-gestational-age (AUC>0.7).
Conclusion(s): The Fenton growth chart categorizes more infants with low FFM as malnourished. Future studies are warranted to evaluate best indicators of healthy growth and refine neonatal malnutrition assessments in preterm infants.
Figure 1. Scatterplots of change in weight Z-score against fat-free mass, fat mass, and body fat percentage Z-scores according to INTERGROWTH, Fenton, and Olsen growth charts, with regression lines stratified by size for gestational age at birth
.jpg) SGA: small for gestational age; AGA: adequate for gestational age; LGA: large for gestational age. p<0.05 for all INTERGROWTH and Fenton regression coefficients representing SGA, AGA and LGA groups.
SGA: small for gestational age; AGA: adequate for gestational age; LGA: large for gestational age. p<0.05 for all INTERGROWTH and Fenton regression coefficients representing SGA, AGA and LGA groups.Figure 2. Boxplots of change in weight Z-score according to INTERGROWTH, Fenton, and Olsen growth charts, stratified by fat-free mass, fat mass, and body fat percentage Z-score categories
 The solid black horizontal line is the weight Z-score cutoff value for malnutrition diagnosis, -0.8. *p < 0.05 for comparisons of the weight Z-score changes from INTERGROWTH chart and Fenton chart among fat-free mass and fat mass categories. Comparing Fenton and INTERGROWTH and considering malnutrition as a binary outcome, Fenton classified more malnutrition in infants with low fat-free mass (46.1% vs. 16.4%, p<0.0001), while INTERGROWTH classified more non-malnourished cases in infants with high fat mass (94.8% vs. 69%, p<0.0001).
Table 1. Body composition Z-scores stratified by malnutrition categories according to INTERGROWTH, Fenton, and Olsen growth charts.

Figure 1. Scatterplots of change in weight Z-score against fat-free mass, fat mass, and body fat percentage Z-scores according to INTERGROWTH, Fenton, and Olsen growth charts, with regression lines stratified by size for gestational age at birth
.jpg) SGA: small for gestational age; AGA: adequate for gestational age; LGA: large for gestational age. p<0.05 for all INTERGROWTH and Fenton regression coefficients representing SGA, AGA and LGA groups.
SGA: small for gestational age; AGA: adequate for gestational age; LGA: large for gestational age. p<0.05 for all INTERGROWTH and Fenton regression coefficients representing SGA, AGA and LGA groups.Figure 2. Boxplots of change in weight Z-score according to INTERGROWTH, Fenton, and Olsen growth charts, stratified by fat-free mass, fat mass, and body fat percentage Z-score categories
 The solid black horizontal line is the weight Z-score cutoff value for malnutrition diagnosis, -0.8. *p < 0.05 for comparisons of the weight Z-score changes from INTERGROWTH chart and Fenton chart among fat-free mass and fat mass categories. Comparing Fenton and INTERGROWTH and considering malnutrition as a binary outcome, Fenton classified more malnutrition in infants with low fat-free mass (46.1% vs. 16.4%, p<0.0001), while INTERGROWTH classified more non-malnourished cases in infants with high fat mass (94.8% vs. 69%, p<0.0001).
Table 1. Body composition Z-scores stratified by malnutrition categories according to INTERGROWTH, Fenton, and Olsen growth charts.


