
Genomics/Epigenomics 2
Session: Genomics/Epigenomics 2
 photo")
Qifei Li, PhD (he/him/his)
Assistant Professor
University of Miami Miller School of Medicine and Holtz Children's Hospital
Miami, Florida, United States
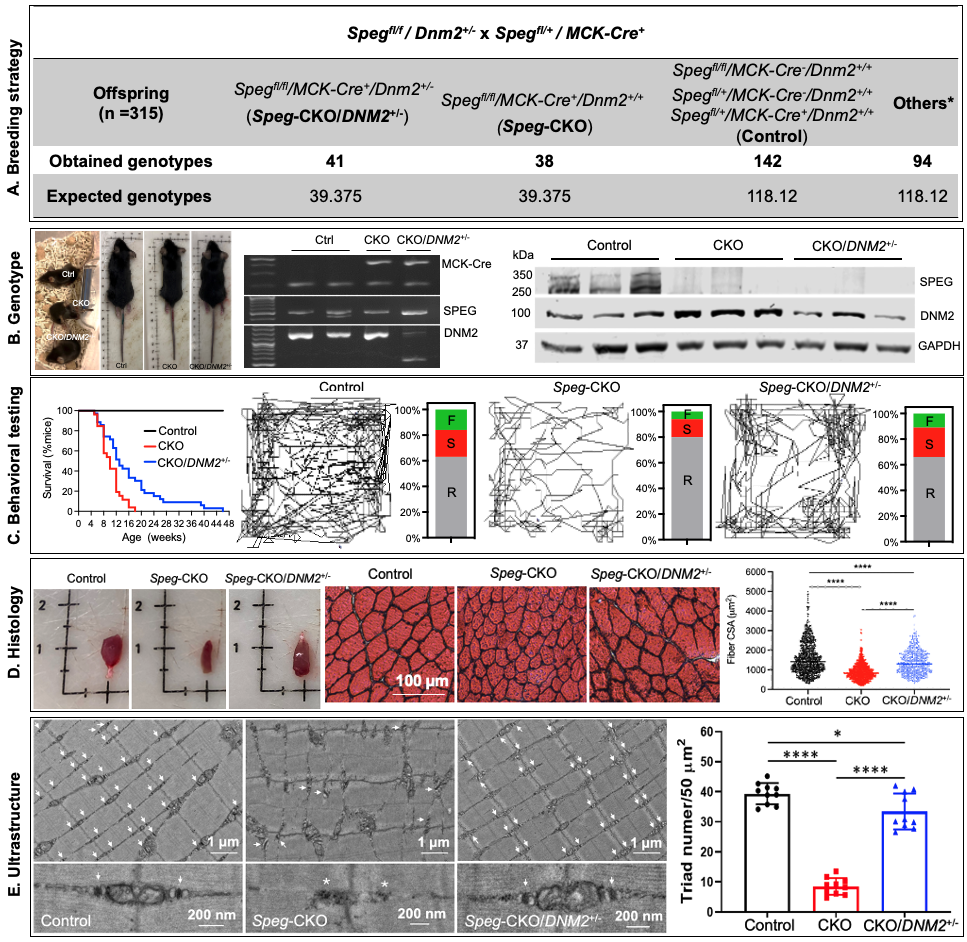 (A) Breeding strategy and outcome for Speg-CKO mice with DNM2 haploinsufficiency (Spegfl/fl/MCK-Cre+/Dnm2+/-: Speg-CKO/DNM2+/-) with expected mice and obtained at 21 days after birth in this study. (B) Left: Representative images of control, Speg-CKO, and Speg-CKO/DNM2+/- mice at 3 months of age and agarose gel analysis of DNA isolated from tails of mice showing the presence or absence of MCK-Cre (top), floxed Speg (middle), and DNM2 (bottom). MCK-Cre+ mice displayed bands for the transgene (~450 bp) and internal positive control (200 bp) while the floxed Speg allele is 485 bp in size versus 422 bp for the WT. DNM2-heterozygous mice displayed 2 bands at 553 bp and 1432 bp versus 1 band at 1432 bp for the WT. Ctrl, control; CKO, Speg-CKO; CKO/DNM2+/-, Speg-CKO/DNM2+/-. Right: Immunoblot analysis of SPEG, DNM2, and GAPDH in skeletal muscles. (C) Left: Life span of Speg-CKO/DNM2+/-, Speg-CKO, and control mice was monitored until 48 weeks of age. Data were represented as percentage survival (control, n = 35; CKO, n = 26; CKO/DNM2+/-, n = 35). Right: Representative mouse activity maps from each genotype of mice and the corresponding activity type distribution graphs at 2 months of age. A clear improvement in ability to explore the arena is observed in Speg-CKO/DNM2+/- mice as compared with Speg-CKO mice. R, resting time; S, slow movement; F, fast movement. (D) Representative TA muscle and H&E staining images at 3 months of age. The mean CSA of Speg-CKO/DNM2+/- TA muscles is significantly larger than that of Speg-CKO (****P < 0.0001, over 500 fibers were analyzed from each group; 1-way ANOVA with Tukey’s post hoc test). (E) Electron micrographs in quadriceps specimens obtained from Speg-CKO/DNM2+/-, Speg-CKO, and control mice at 3 months of age. The upper panel shows an overall organization of muscle structure, and the lower panel shows an enlarged view of triad ultrastructure (white arrows) from each group. Abnormal and fewer triads (white asterisk) are noted in Speg-CKO mice. The number of triads per 50 μm2 was significantly decreased in Speg-CKO mice compared with control mice. However, the triad number in Speg-CKO/DNM2+/- mice was remarkably increased compared with Speg-CKO mice. Each dot represents a randomly selected field to count the triad number; *P ˂ 0.05; ****P < 0.0001; n = 3 per genotype.