
Neonatal General 1: Respiratory, BPD
Session: Neonatal General 1: Respiratory, BPD
 photo")
Cindy T. McEvoy, MD, MCR (she/her/hers)
Professor of Pediatrics
Oregon Health & Science University School of Medicine
Portland, Oregon, United States
.jpg) Table
Table.jpg) Volcano plot of results from metabolome-wide association study (MWAS) using ANCOVA comparing blood metabolite levels between stable infants randomized to extended vs. discontinued CPAP (eCPAP -v- dCPAP). Individual dots represent a single metabolite colored by super pathway. Dots above the dashed red line represent metabolites that differed by randomized treatment group at p<0.05. The data shows there are multiple metabolites whose levels are significantly different between eCPAP and dCPAP.
Volcano plot of results from metabolome-wide association study (MWAS) using ANCOVA comparing blood metabolite levels between stable infants randomized to extended vs. discontinued CPAP (eCPAP -v- dCPAP). Individual dots represent a single metabolite colored by super pathway. Dots above the dashed red line represent metabolites that differed by randomized treatment group at p<0.05. The data shows there are multiple metabolites whose levels are significantly different between eCPAP and dCPAP.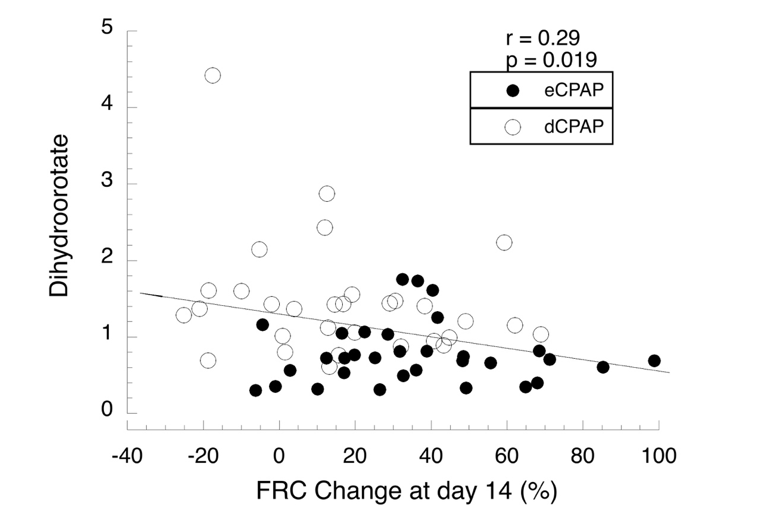 Regression analysis for blood levels of dihydroorotate, a precursor for de novo pyrimidine synthesis vs change in FRC for all 64 infants. Levels of metabolites were compared by ANCOVA and linear regression. TableVolcano plot of results from metabolome-wide association study (MWAS) using ANCOVA comparing blood metabolite levels between stable infants randomized to extended vs. discontinued CPAP (eCPAP -v- dCPAP). Individual dots represent a single metabolite colored by super pathway. Dots above the dashed red line represent metabolites that differed by randomized treatment group at p<0.05. The data shows there are multiple metabolites whose levels are significantly different between eCPAP and dCPAP.Regression analysis for blood levels of dihydroorotate, a precursor for de novo pyrimidine synthesis vs change in FRC for all 64 infants. Levels of metabolites were compared by ANCOVA and linear regression.