330 - Heart rate variability and severe intraventricular haemorrhage in preterm infants
Friday, April 25, 2025
5:30pm – 7:45pm HST
Publication Number: 330.5445
Magdalena Smolkova, University of Cambridge School of Clinical Medicine, Cambridge, England, United Kingdom; John Sunwoo, Mass General/ Harvard Med School, Boston, MA, United States; Seh Hyun Kim, Seoul National University Children's Hospital, Seoul, Seoul-t'ukpyolsi, Republic of Korea; Katie Hannon, Brigham and Women’s Hospital, Boston, MA, United States; Hanine Chami, Brigham and Women's Hospital, Boston, MA, United States; Sara Cherkerzian, Harvard Medical School, Boston, MA, United States; Mohamed El-Dib, Harvard Medical School - Brigham and Women's Hospital, Boston, MA, United States
Associate Professor of Pediatrics Harvard Medical School - Brigham and Women's Hospital Boston, Massachusetts, United States
Background: Intraventricular haemorrhage (IVH) is a significant complication of extreme prematurity, often leading to long-term neurological impairment or mortality. While cranial ultrasound is commonly used to screen at-risk infants, diagnoses can be delayed. Prior research suggests that decreased heart rate variability (HRV) is associated with severe IVH (sIVH) development. Objective: The aim of this study is to identify the HRV metrics most predictive of sIVH in preterm infants. Design/Methods: In this prospective cohort study, we collected ECG traces for extremely preterm infants (≤ 28 weeks’ gestation) throughout the 1st week of life, selecting the earliest 2-hour noise-free segments for analysis. We extracted 8 different metrics of HRV spanning the three domains of HRV using MATLAB. For the time domain we included the standard deviation of the R-to-R interval (SDRRI), for the frequency domain its high (HF), low and very-low frequency parameters and for the non-linear domain, we included the SD1 and SD2 parameters derived through Poincaré analysis and α1 and α2 derived by detrended fluctuation analysis. Differences in these metrics by sIVH (grade III and IV) status were tested using Wilcoxon rank-sum test with false discovery rate adjustment. Sensitivity analysis was carried out in the full cohort. Classification performance was assessed using Receiver Operating Characteristic (ROC) Area Under the Curve (AUC) and optimal cut-off determined by Youden’s Index. Results: Among 48 infants, 7 developed sIVH (full cohort) and 5 developed sIVH post-ECG recording (late sIVH cohort). Infants with late sIVH had significantly lower Apgar scores, birth weights, and gestational ages, along with higher mortality than non-sIVH infants (p < 0.05, Table 1). Five out of eight metrics were lower in the full sIVH cohort, but only SD1 and HF remained significantly lower following sensitivity analysis. All metrics except α2 were lower in late sIVH compared to non-sIVH infants (Figure 1). SD1 demonstrated the highest classifier performance (AUC: 0.97 in the late cohort), achieving 100% sensitivity and 90.2% specificity at the optimal cut-off. HF showed the second highest AUC (0.95 in the late cohort), with 100% sensitivity and 85.4% specificity. (Figure 2)
Conclusion(s): Among the HRV metrics assessed, reductions in SD1 and HF show a strong association with sIVH in preterm infants. These markers, reflecting parasympathetic tone, may serve as valuable indicators for early detection of sIVH.
Table 1 – Descriptive statistics of the late sIVH cohort. 
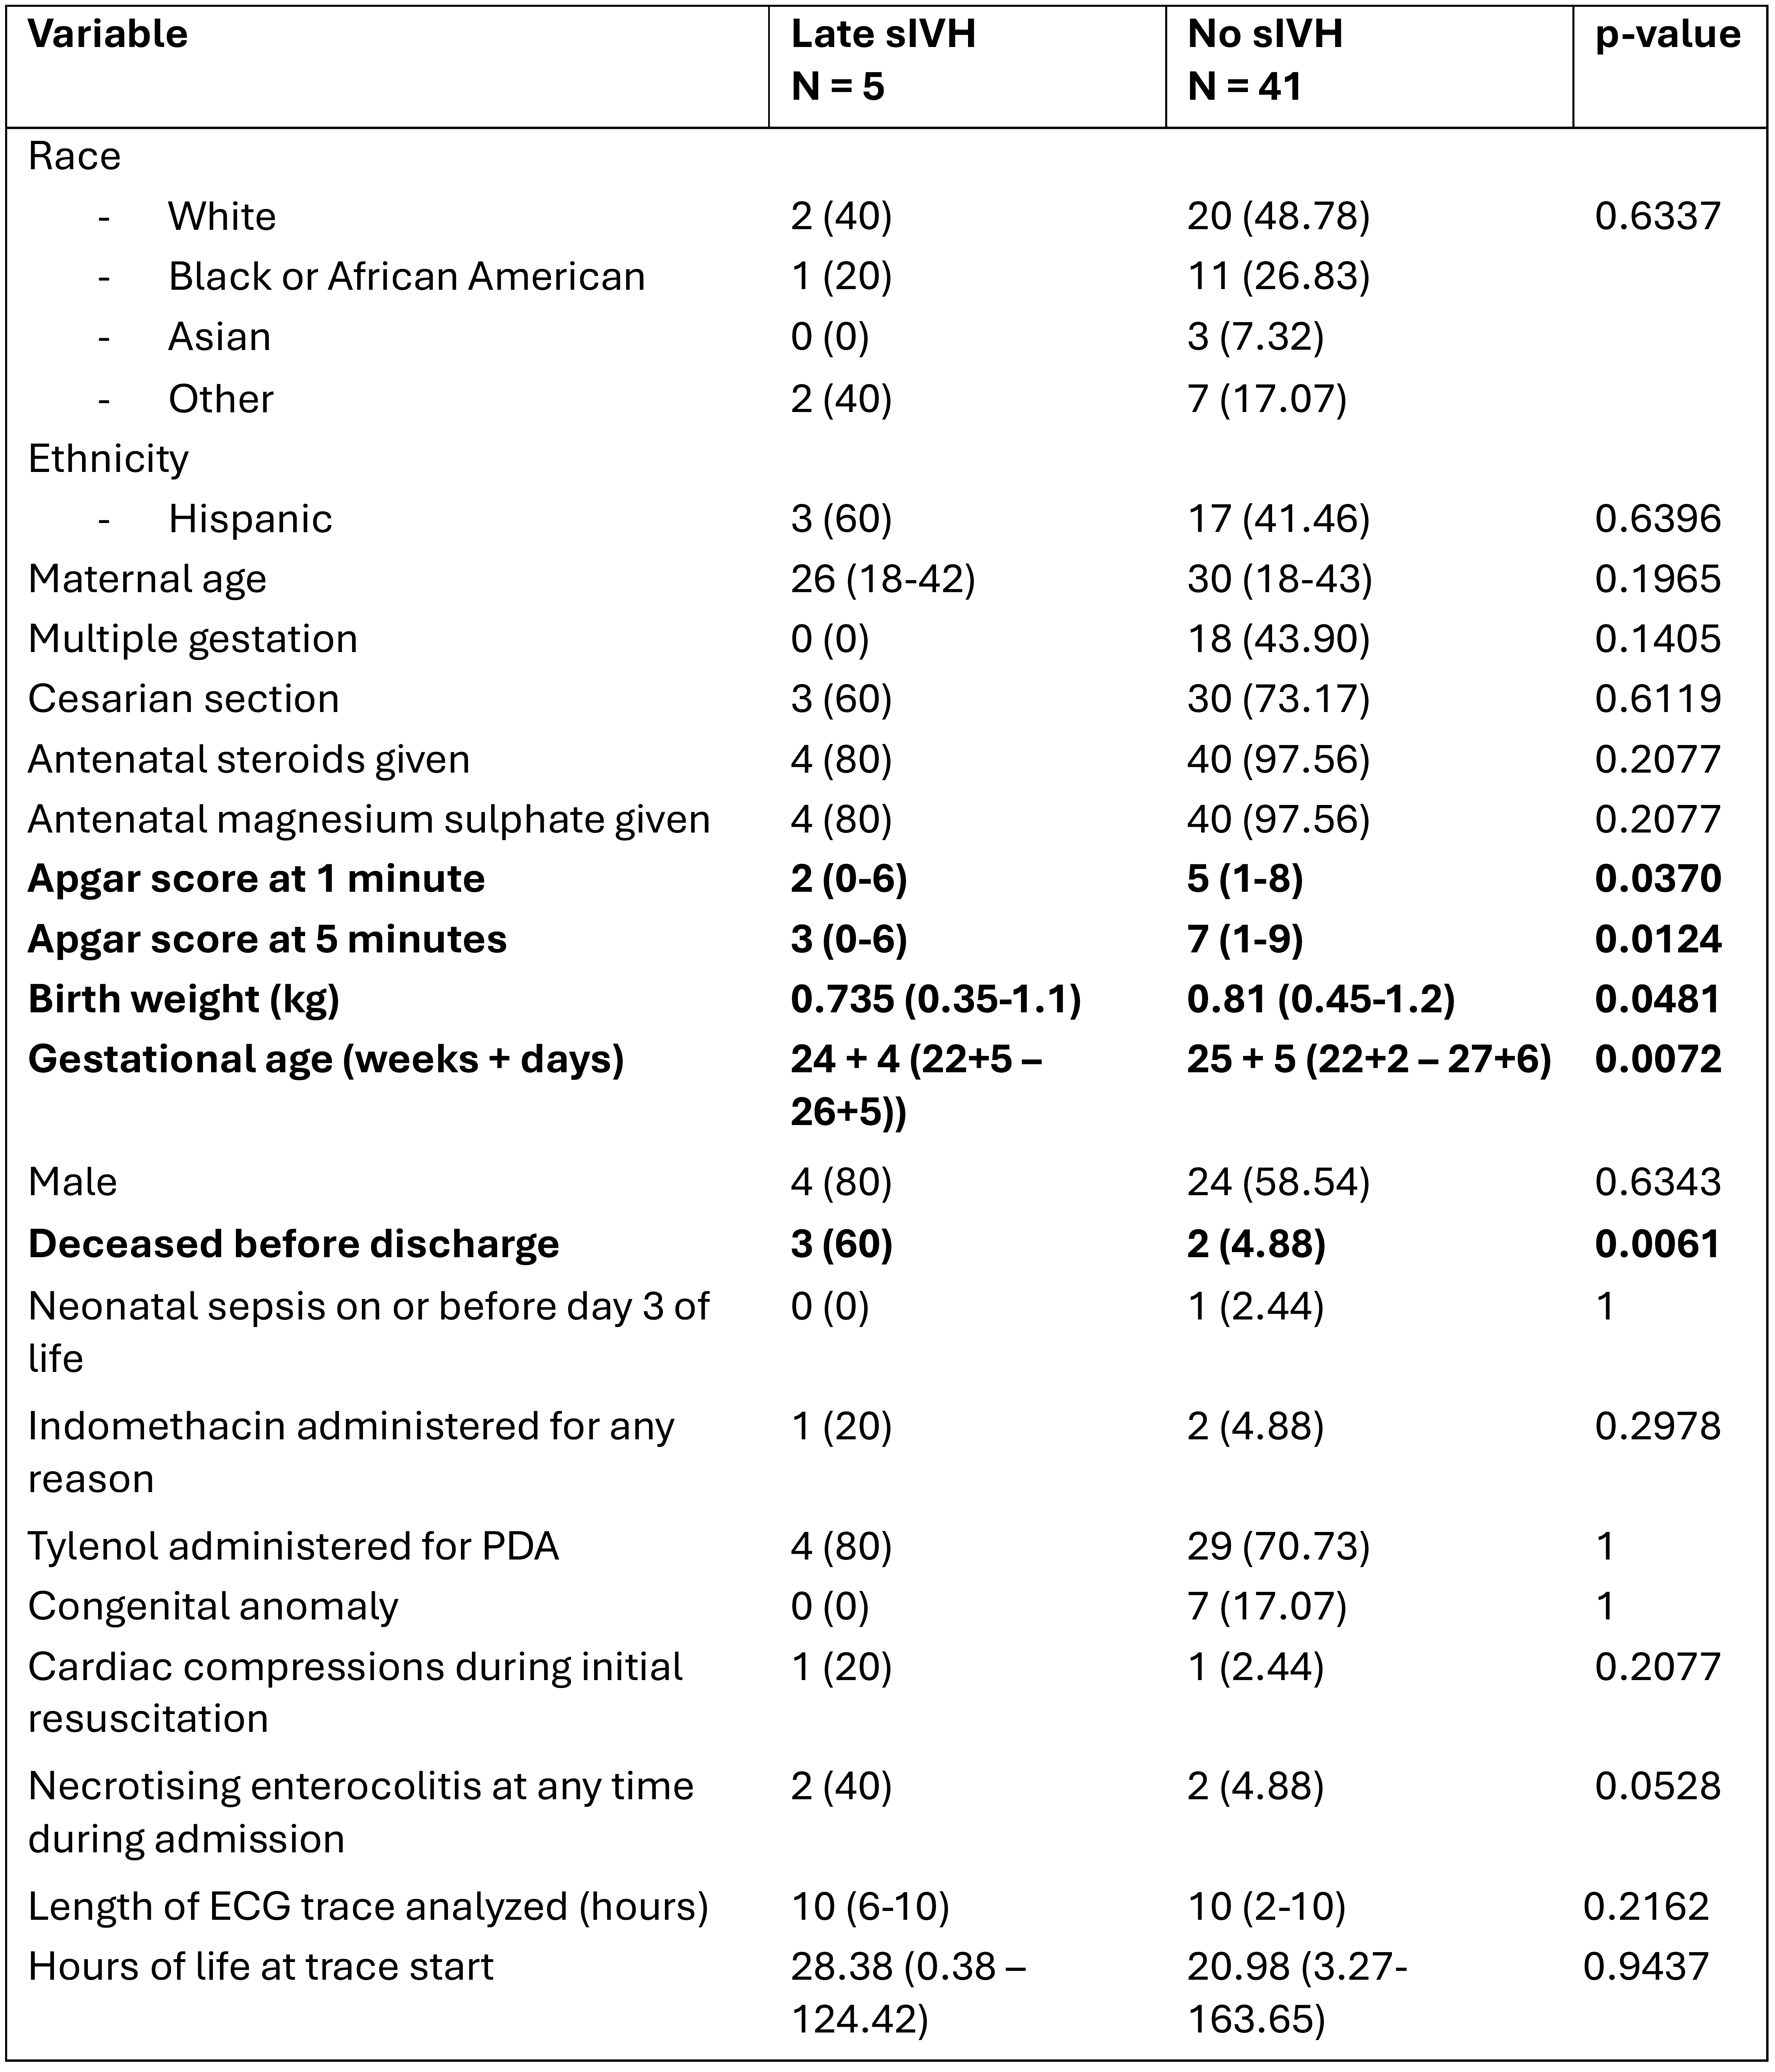
Statistical analysis of demographic data was carried out using Wilcoxon rank sum or 2 test (Fisher’s exact for variables with cell counts 5 or < 5) for continuous and categorical variables, respectively. No sIVH group also includes infants with low grade IVH (grades I and II). PDA = patent ductus arteriosus
Figure 1- Heart rate variability metrics in infants with and without sIVH in the late IVH cohort. Each infant is represented by one dot. Pink denotes infants without sIVH and blue denotes infants with sIVH. The horizontal line represents the median value for each category. Analysis was carried out using Wilcoxon rank sum test with FDR adjustment. Threshold for significance was 0.05. * denotes p < 0.05, ** denotes p < 0.01, and ns denotes results that were not significant. SDRRI = standard deviation of the R-to-R interval HF = high frequency LF = low frequency VLF = very low frequency
Figure 2 – ROC curves for each heart rate variability metric in the late IVH cohort 
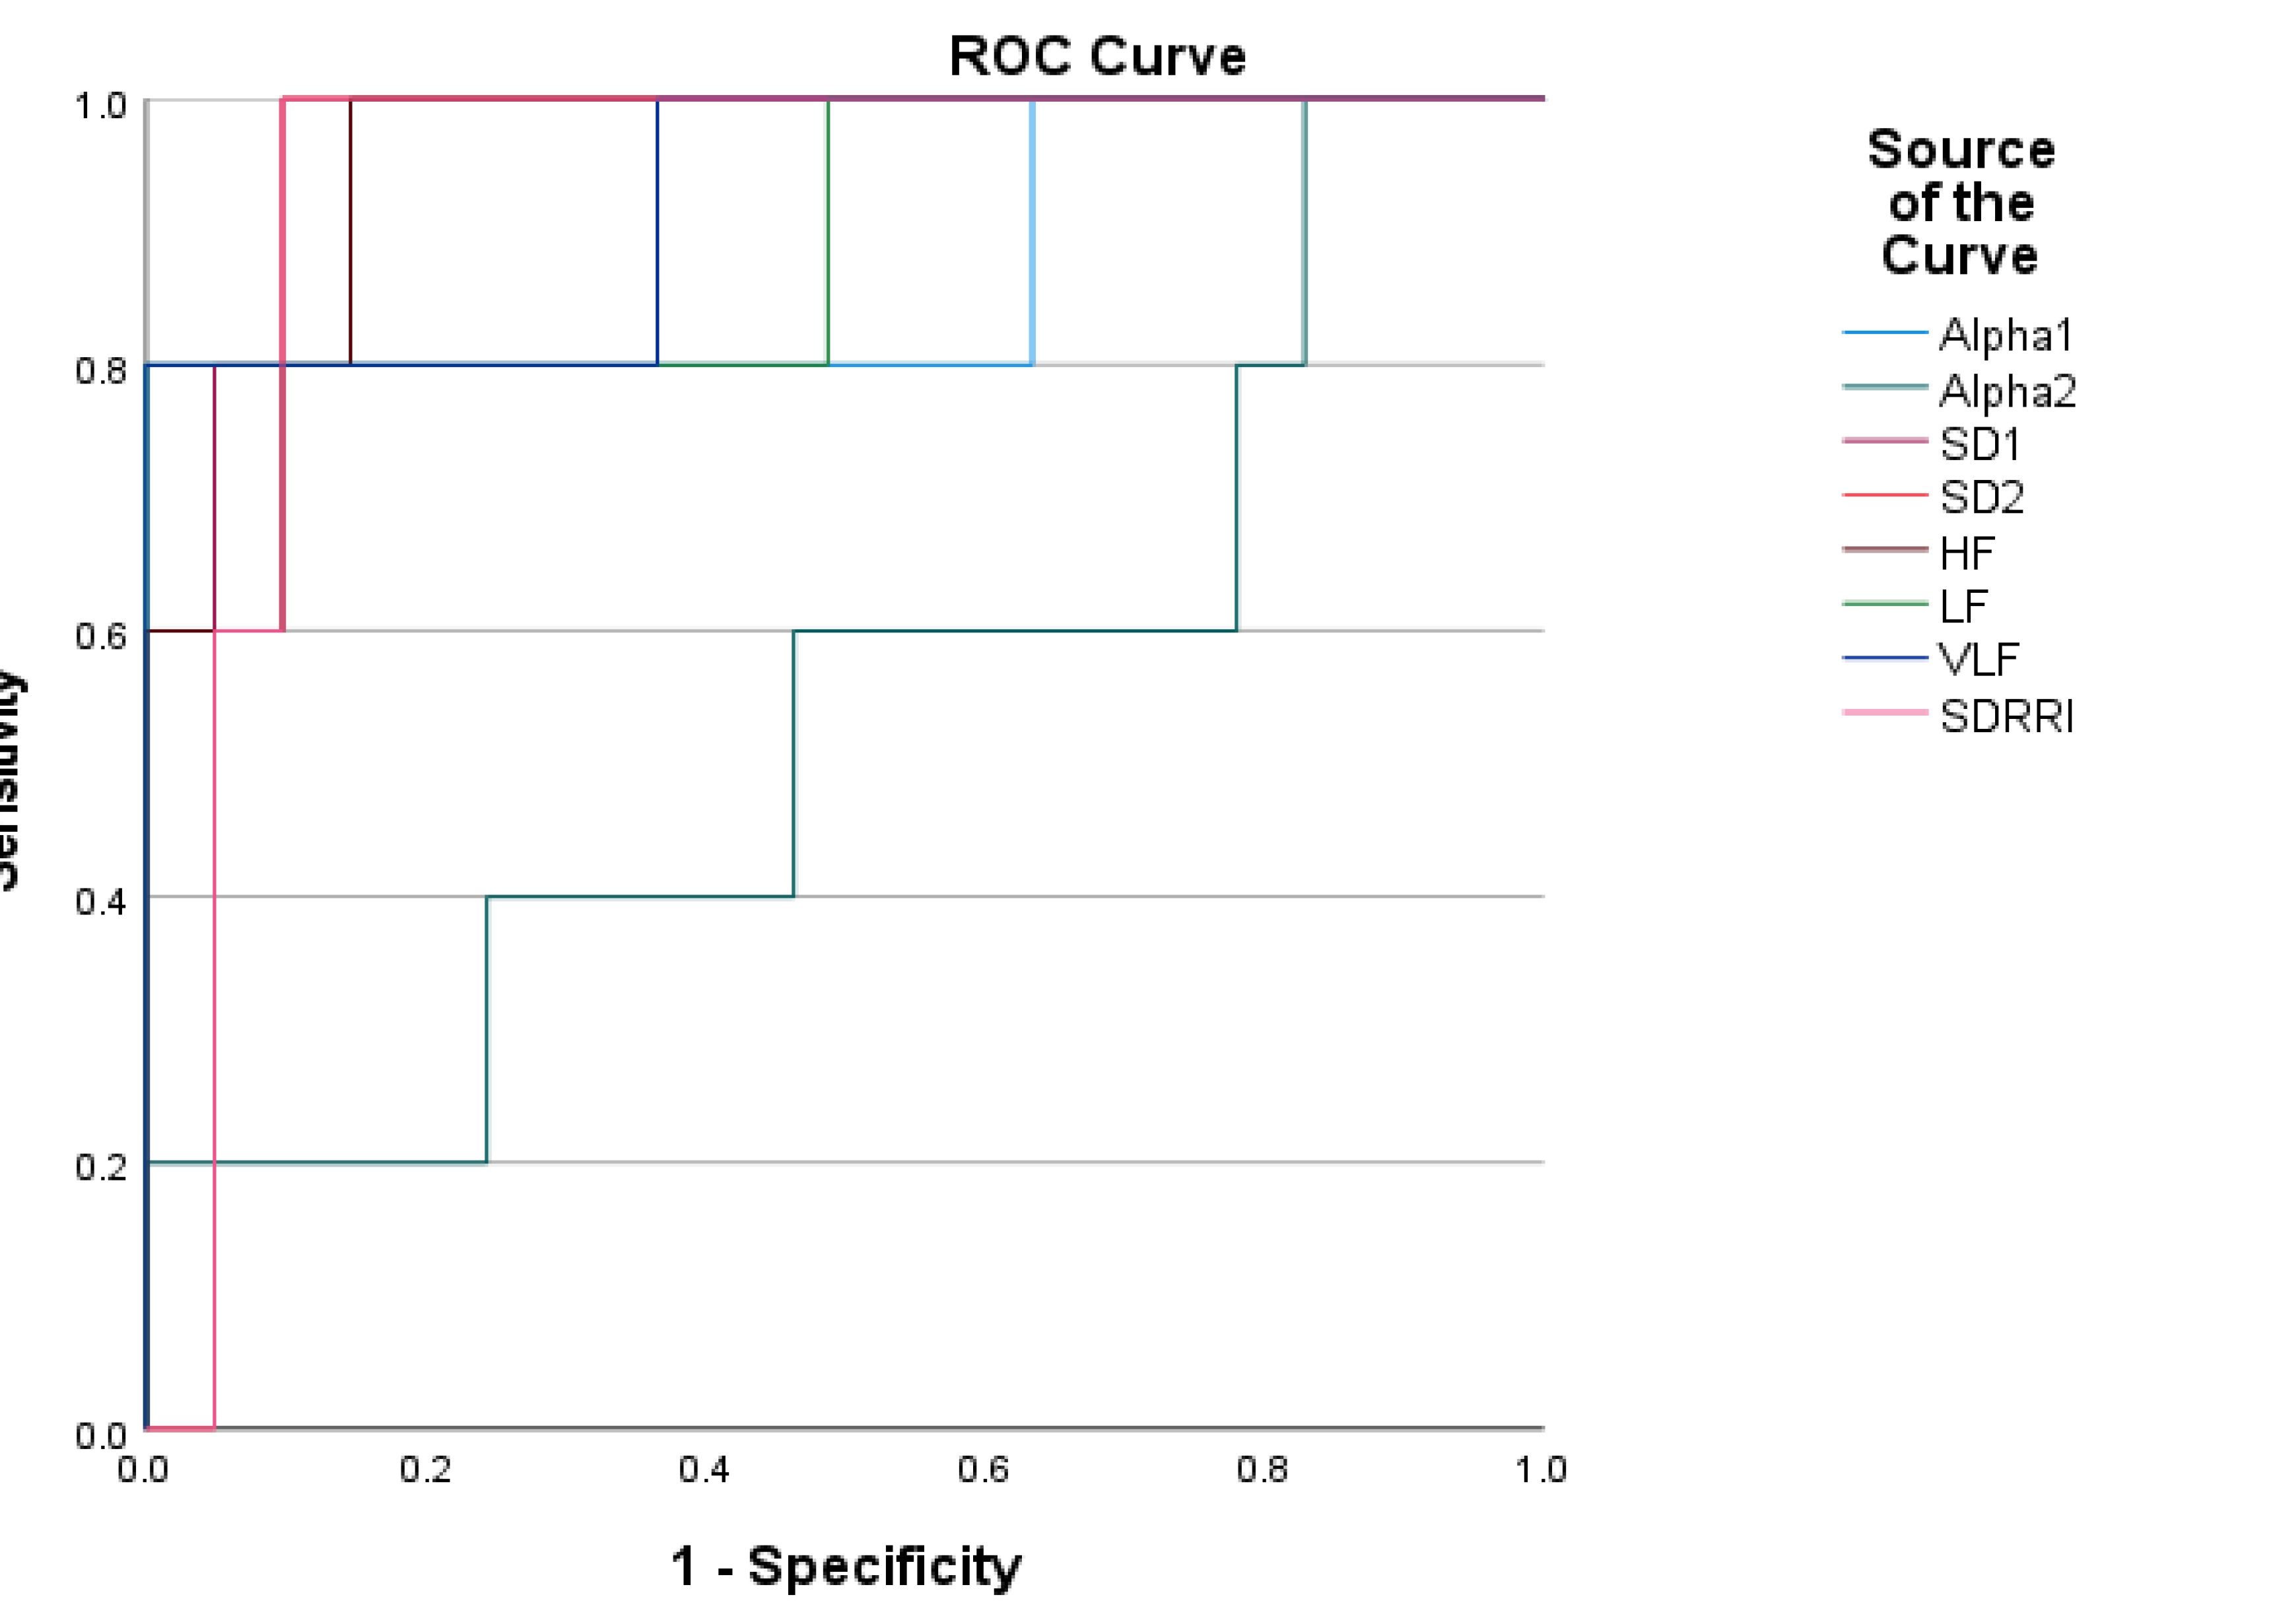
The source of the curve is given in the legend on the right-hand-side. In order of performance, the AUCs were SD1 (0.971), HF (0.951), SD2 and SDRRI (both 0.932), VLF (0.927), LF (0.902), alpha1 (0.873) and alpha2 (0.537). SDRRI = standard deviation of the R-to-R interval HF = high frequency LF = low frequency VLF = very low frequency